U.S. Energy Information Administration logo
Skip to sub-navigation
November 4, 2011

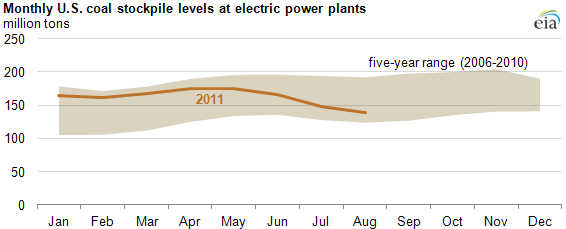
U.S. coal stockpile levels at electric power plants approach five-year low
graph of U.S. coal stockpile levels at electric power plants approach five-year low, as described in the article text
Source: U.S. Energy Information Administration, Electricity Monthly Update.
Note: Stocks displayed above are for power plants in the electric sector only.
Download CSV Data

Total coal stockpile levels at U.S. electric power plants were 139 million tons in August 2011—the lowest total level for August since 2006. Bituminous coal stockpiles declined the most, down 27% since August 2009. Increases in the spot price of Central Appalachian coal as well as some supply disruptions in the late spring of 2011 contributed to declining stock levels.

Coal stockpile levels typically decline during summer months as power plants burn through stocks to meet seasonal peak electric demand for air conditioning load. Stockpile levels have been depressed throughout 2011 compared to 2009 and 2010 levels. According to average monthly data, the spot price of Central Appalachian coal (a key benchmark for the price of Eastern bituminous coal) was up 18% since August 2010. Flooding in April and May disrupted some coal deliveries, especially in the Southeast, and likely played a role in the declining stock levels going into the summer of 2011.

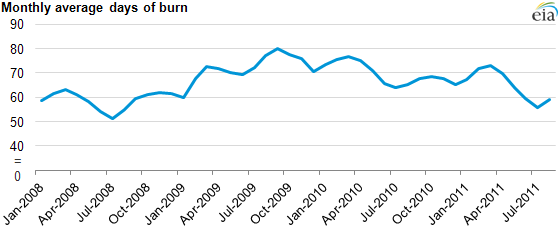
"Days of burn," another measure of the disposition of coal stocks, dipped under 60 days by mid-year 2011 for the first time since 2008. The average number of days of burn held at electric power plants is a forward-looking estimate of coal supply, given a power plant's current stockpile and past consumption patterns. Mostly for reliability reasons, plant operators maintain stockpiles within certain ranges even though supply disruptions in excess of 60 days are relatively unlikely. Days of burn held generally rose in 2009 as a result of the reduced electricity demand associated with lower economic activity.
graph of monthly average days of coal burn, as described in the article text
Source: U.S. Energy Information Administration, Electricity Monthly Update.
Download CSV Data

Statistics
Analysis
Tools
Education
News

Petroleum & Other Liquids

Crude oil, gasoline, heating oil, diesel, propane, and other liquids including biofuels and natural gas liquids.

Natural Gas

Exploration and reserves, storage, imports and exports, production, prices, sales.

Electricity

Sales, revenue and prices, power plants, fuel use, stocks, generation, trade, demand & emissions.

Coal

Reserves, production, prices, employment and productivity, distribution, stocks, imports and exports.

Nuclear & Uranium

Uranium fuel, nuclear reactors, generation, spent fuel.

Renewable & Alternative Fuels

Includes hydropower, solar, wind, geothermal, biomass and ethanol.

EIA Survey Forms

Forms EIA uses to collect energy data including descriptions, links to survey instructions, and additional information.

Total Energy

Comprehensive data summaries, comparisons, analysis, and projections integrated across all energy sources.

U.S. States

State energy information, including overviews, rankings, data, and analyses.

International

International energy information, including overviews, rankings, data, and analyses.

Environment

Greenhouse gas data, voluntary reporting, electric power plant emissions.

Data Tools, Apps, & Maps

Tools to customize searches, view specific data sets, study detailed documentation, and access time-series data.

Open Data

EIA's free and open data available as API, Excel add-in, bulk files, and widgets

EIA Beta

Come test out some of the products still in development and let us know what you think!

Open Source Code

EIA's open source code, available on GitHub.

RSS Feeds

Subscribe to feeds for updates on EIA products including Today in Energy and What's New.