Energy commodity prices fell significantly in the last quarter of 2018
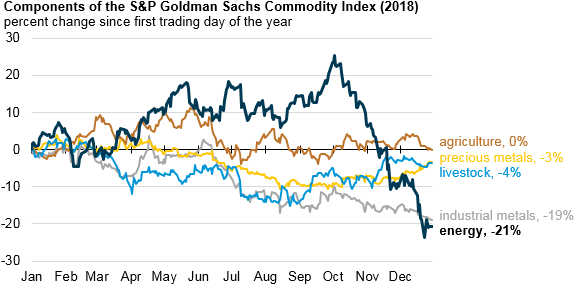
Note: S&P GSCI indices shown in the chart are spot return indices, which only reflect levels of futures contracts included in the index.
After increasing 25% from January through the beginning of October in 2018, the spot energy index in the S&P Goldman Sachs Commodity Index (GSCI) ended the year 21% lower than at the beginning of the year. The S&P GSCI is a weighted average of commodity prices intended to reflect global commodity production quantities and futures contracts’ trading volumes. Although all components of the S&P GSCI fell in 2018, the S&P GSCI energy index fell more than any other sub-index. Steep declines in crude oil and petroleum product prices in the fourth quarter of 2018 were responsible for the decline in the S&P GSCI energy index.
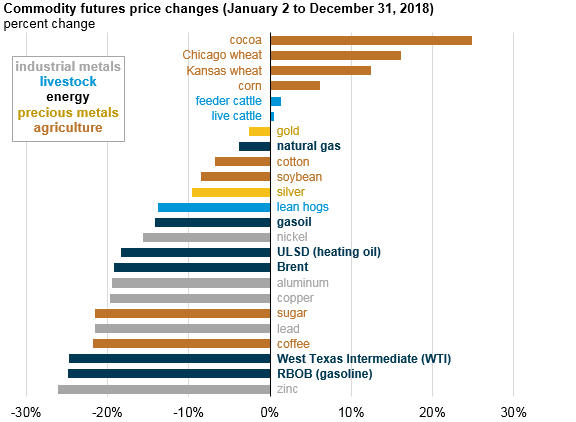
Note: The 24 commodities in the graph above comprise the S&P GSCI. All price changes reflect changes in front-month futures contract prices for each commodity. RBOB is reformulated gasoline blendstock for oxygenate blending, and ULSD is ultra-low sulfur diesel.
West Texas Intermediate (WTI) and Brent, two major crude oil benchmarks, account for 71% of the weighting in the S&P GSCI energy index. As a result, the energy index tends to follow major price movements in the crude oil market. The weights associated with individual commodities within the S&P GSCI are updated every year in response to changes in global commodity production quantities and futures contracts’ trading volumes.
Crude oil prices had been increasing since prices fell to lower than $30 per barrel (b) in early 2016. For most of 2018, crude oil prices rose because of the increased potential for supply constraints and declining global petroleum inventories. When the United States announced its intention to reinstitute sanctions against Iran, several major oil importing countries began decreasing the amount of Iranian crude oil they imported.
Brent crude oil reached a four-year high of $86/b on October 3, 2018. However, several factors contributed to the subsequent sharp fall in crude oil prices. Crude oil production in the United States, Russia, and Saudi Arabia increased to at or near record highs. Concerns about slowing global economic growth and its impact on oil demand also contributed to recent declines in crude oil prices. Waivers granted to certain countries that import Iranian crude oil also helped to ease concerns about crude oil availability in the near term. Crude oil prices ended 2018 lower than where they started at the beginning of the year for the first time since 2015.
Petroleum-based products such as reformulated gasoline blendstock for oxygenate blending (RBOB), ultra-low sulfur diesel (ULSD), and gasoil together accounted for 22% of the S&P GSCI energy index in 2018. RBOB had the largest price decline among the energy commodities because gasoline inventories have been relatively high and gasoline consumption has been relatively flat or declining. RBOB prices fell to lower than the price of Brent crude oil in November 2018 for the first time since 2011. ULSD and gasoil prices, on the other hand, did not fall as much because of increased consumption and low inventories of those fuels.
Natural gas accounted for the remaining 7% of the S&P GSCI energy index. Natural gas had the smallest price decline among the energy commodities in 2018. For much of 2018, natural gas prices remained relatively low and stable because of continued natural gas production growth. However, with U.S. temperatures in November falling to the lowest in four years for that month and natural gas inventories reaching relatively low levels, natural gas prices rose sharply between November and early December 2018. Natural gas prices subsequently fell toward the end of December and ended the year slightly lower than where they started in 2018.
Principal contributor: Rebecca George
Tags: prices, liquid fuels, crude oil, oil/petroleum