
Changes in coal sector led to less SO2 and NOx emissions from electric power industry
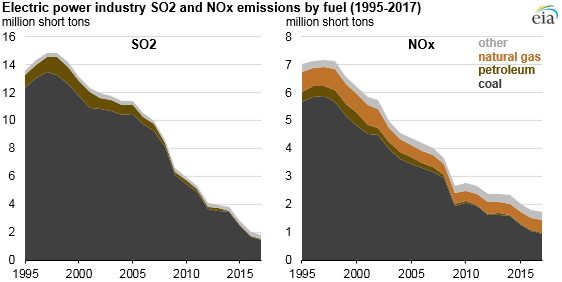
Annual U.S. electric power industry emissions of sulfur dioxide (SO2) and nitrogen oxides (NOx) have declined by 88% and 76%, respectively, between their peaks in 1997 and 2017. During this period, coal-fired generation was responsible for 90% of SO2 emissions and 76% of NOx emissions from the U.S. electric power industry. Among other factors, declining coal-fired generation and implementation of environmental regulations under the Clean Air Act Amendments (CAAA) of 1990 have both contributed to the decrease in electric power industry SO2 and NOx emissions.
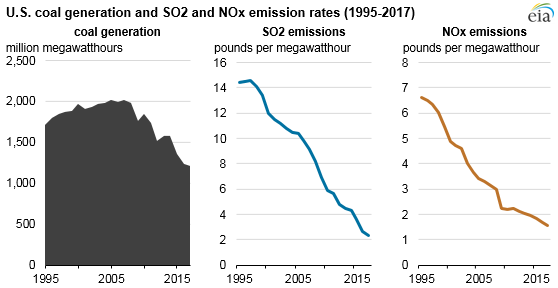
Coal-fired generation for electric power peaked in the United States in 2007 at 2,016 million megawatthours (MWh) and declined to 1,206 million MWh by 2017. The decline in electric power sector coal-fired generation has been driven by increased competition from natural gas and renewable generation, along with environmental regulations that mainly affected coal-fired generators. Coal accounted for more than 50% of U.S. electricity generation in 1997, and natural gas and renewables together accounted for 26% of generation. By 2017, coal-fired generation had declined to 30% of electricity generation while generation from natural gas and renewables grew to nearly 50% of electric power industry generation.
In addition to burning less coal to generate electricity, the rate at which coal-fired power plants emit SO2 and NOx has also declined during the past two decades, primarily as a result of plants complying with environmental regulations under the CAAA. In 1997, each megawatthour of coal-fired electricity generation produced 14.6 pounds of SO2 and 6.4 pounds of NOx. By 2017, those rates had fallen to 2.4 pounds per megawatthour (lbs/MWh) and 1.5 lbs/MWh, respectively.
The CAAA required several regulations that reduced emissions of SO2 and NOx. The Acid Rain Program imposed a cap on emissions of SO2 and NOx from coal and residual-fuel oil-fired power plants starting in 1995. The main compliance approach by electric generators for Mercury and Air Toxics Standards (MATS), with an April 2015 initial deadline, was to install flue-gas desulfurization (scrubber) or dry sorbent injection equipment, both of which also remove SO2 and NOx in addition to the targeted air pollutants regulated under MATS. In 2005, the Clean Air Interstate Rule (CAIR) addressed regional interstate transport of contributors to ground-level ozone (smog) by requiring 27 eastern states to file implementation plans to reduce SO2 and NOX emissions. CAIR was replaced by the Cross-State Air Pollution Rule (CSAPR) in 2015.
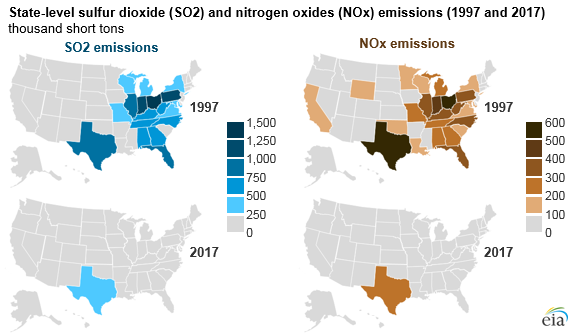
The 27 states regulated under CAIR accounted for more than 80% of both coal-fired electricity generation and national SO2 and NOx power sector emissions in 1997. The decline in emissions between 1997 and 2017 mostly occurred in these 27 states; Ohio, Pennsylvania, and Indiana saw the greatest decline in SO2 emissions between 1997 and 2017, while Ohio, Indiana, and Kentucky saw the greatest decline in NOx emissions.
Principal contributor: Cara Marcy
Tags: generation, coal, electricity, emissions, map