U.S. coal consumption in 2018 expected to be the lowest in 39 years
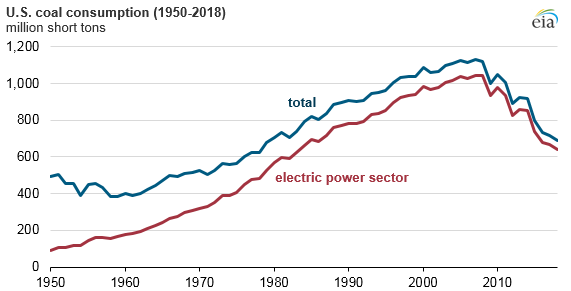
EIA expects total U.S. coal consumption in 2018 to fall to 691 million short tons (MMst), a 4% decline from 2017 and the lowest level since 1979. U.S. coal consumption has been falling since its peak in 2007, and EIA forecasts that 2018 coal consumption will be 437 MMst (44%) lower than 2007 levels, mainly driven by declines in coal use in the electric power sector.
The electric power sector is the nation’s largest consumer of coal, accounting for 93% of total U.S. coal consumption between 2007 and 2018. The decline in coal consumption since 2007 is the result of both the retirements of coal-fired power plants and the decreases in the capacity factors, or utilization, of coal plants as increased competition from natural gas and renewable sources have reduced coal’s market share.
In 2007, coal-fired capacity in the United States totaled 313 gigawatts (GW) across 1,470 generators. By the end of 2017, 529 of those generators, with a total capacity of 55 GW, had retired. So far in 2018, 11 GW of coal-fired generating capacity has retired through September, and another 3 GW are expected to retire in the final three months of the year, based on data reported to EIA by plant owners and operators. If these plants retire as planned, 2018 will be the second-highest year for coal retirements. Another 4 GW of capacity are planning to retire by the end of 2019.
Only one, relatively small, new coal-fired generator with a capacity of 17 megawatts is expected to come online by the end of 2019. The decline in coal-fired capacity is expected to further reduce coal consumption: EIA’s latest Short-Term Energy Outlook expects power sector coal consumption to fall 4% in 2018 and 8% in 2019.
One of the main drivers of coal retirements is the price of coal relative to natural gas. Natural gas prices have stayed relatively low since domestic natural gas production began to grow in 2007. This period of sustained, low natural gas prices has kept the cost of generating electricity with natural gas competitive with generation from coal. Other factors such as the age of generators, changes in regional electricity demand, and increased competition from renewables have led to decreasing coal capacity.
Environmental concerns have also played a role in coal retirements. Coal retirements were highest in 2015, driven in part by stricter emissions standards required by the Mercury and Air Toxics Standards (MATS) rule, which went into effect in April of that year for coal- and natural gas-fired power plants. Instead of investing in emissions control technologies, many smaller power plants that operated at lower capacity factors were retired before the new standards were implemented. Some plants applied for and received one-year extensions, which contributed to retirements in 2016.
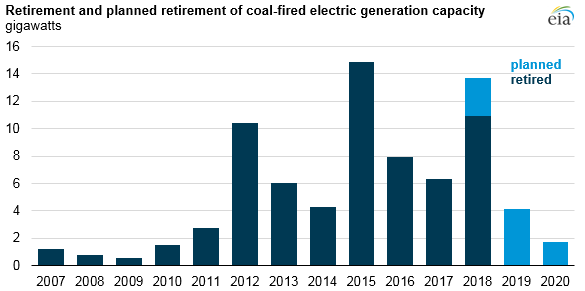
Note: Actual retirements in 2018 based on data through September.
Principal contributors: Stacy MacIntyre, Scott Jell