U.S. average gasoline prices this Thanksgiving are higher than the previous three years
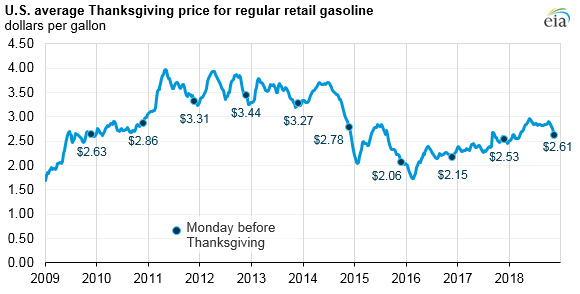
Heading into the Thanksgiving holiday weekend, U.S. retail regular-grade gasoline averaged $2.61 per gallon (gal), up 4 cents/gal from the same time last year. This year marks the highest gasoline price for the Monday before the Thanksgiving holiday weekend since 2014.
The Thanksgiving holiday weekend is one of the heaviest travel times of the year. AAA forecasts 54.3 million people will be traveling 50 miles or more for the holiday this year, 2.5 million more travelers than last year and the most since 2005. Of the 54.3 million total travelers, AAA expects that 48.5 million of them will drive.
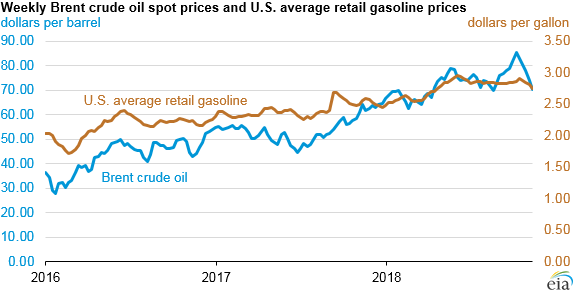
This year, retail gasoline prices have increased steadily from January through May, before steadying between $2.85 per gallon and $2.90 per gallon for June through October. Prices started the year at $2.52 per gallon on January 1 and peaked at $2.96 per gallon on May 28, based on weekly data collected in EIA’s Gasoline and Diesel Fuel Update. Recently, retail gasoline prices have fallen slightly, partly because of seasonal factors. Gasoline prices are often higher in summer months when gasoline demand is higher and when federal and state environmental regulations require the use of summer-grade gasoline, which is more expensive to manufacture.
Gasoline prices continue to be closely linked to crude oil prices. The spot price for Brent, a key global crude oil benchmark, was $64.14 per barrel as of November 19, about $3 per barrel higher than the price from the same time last year. The Brent crude oil spot price has recently decreased from a weekly average of $85.44 for the week ending on October 5 to a weekly average of $70.34 for the week ending on November 9. The decrease in Brent crude oil prices, combined with other factors, has contributed to a more than 20 cent/gal fall in the U.S. average retail gasoline price since the week of October 8, 2018.
Retail gasoline prices vary significantly within the United States as a result of regional supply and demand balances, gasoline specification requirements, and taxes. The U.S. Gulf Coast—Petroleum Administration for Defense District (PADD) 3—typically has the lowest retail gasoline prices in the country because it has approximately half of U.S. refining capacity and produces more gasoline than it consumes. Through November 19, average Gulf Coast gasoline prices were 30 cents/gal lower than the national average, while West Coast (PADD 5) prices were 74 cents/gal higher.
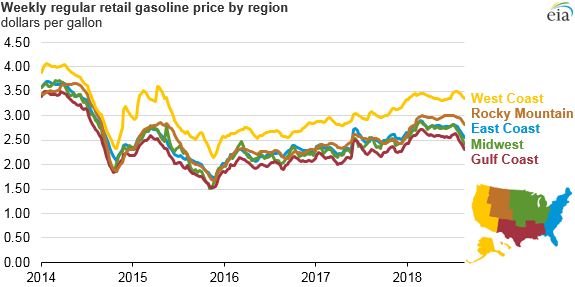
West Coast retail gasoline prices are often higher than the average U.S. price because of the region’s tight supply and demand balance, isolation from additional supply sources, and gasoline specifications that result in higher refining costs. Since January 8, 2018, weekly West Coast regional gasoline prices have consistently exceeded $3.00/gal. Although state-level gasoline taxes and fees in California and Washington each are nearly 50 cents/gal, state-level gasoline taxes and fees across PADD 5 average 29 cents/gal, which is less than one cent/gal higher than the national average.
Principal contributor: Kelsey Hallahan
Tags: prices, gasoline, liquid fuels