Seasonality in Brazilian petroleum liquids production is driven by biofuels
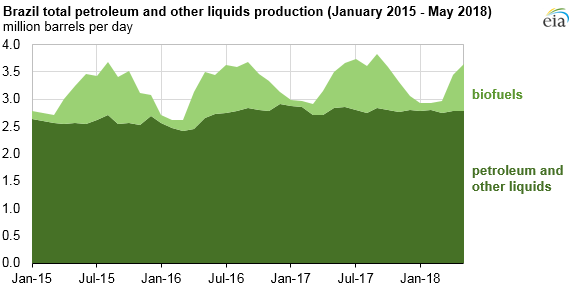
Brazil’s ethanol output is seasonal and typically peaks during the fourth quarter (October–December) of each year. The peak coincides with the harvest of sugarcane, the primary feedstock used in Brazil's ethanol production. This seasonal fuel ethanol production can lead to significant monthly variations in Brazil’s total petroleum and other liquids production.
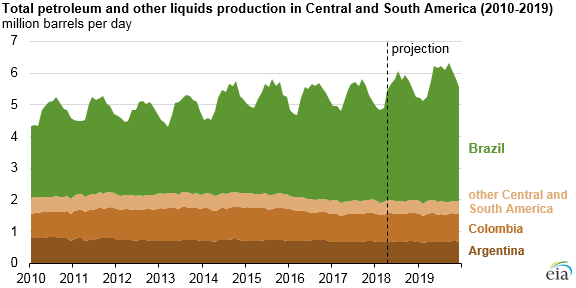
Because Brazil accounts for more than 60% of total petroleum and other liquids production in Central and South America, the seasonality in Brazil’s ethanol output affects the entire region’s production. EIA’s Short-Term Energy Outlook, which publishes the monthly outlook for all production in the region, reflects this seasonality.
Brazil produced 3.36 million barrels per day (b/d) of petroleum and other liquids in 2017, of which nearly 20% were biofuels (0.56 million b/d). Most of Brazil’s biofuel production comes from ethanol and, to a lesser extent, biodiesel. Brazil is the world's second-largest ethanol producer, behind the United States.
Production of ethanol and biodiesel in Brazil during the first three months of 2018 was higher than during the same period in 2017 because of low sugar prices. International sugar prices recently fell to their lowest levels since 2015, and as a result Brazilian sugar mills reduced sugar output and increased ethanol production, where demand has been rising.
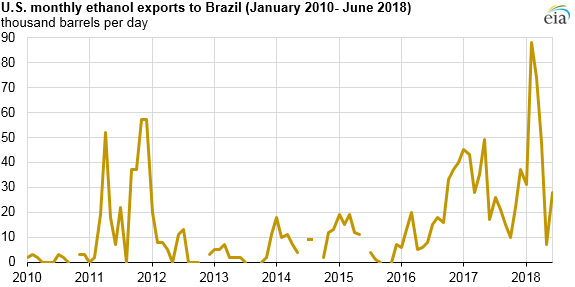
The seasonality of sugarcane harvests means Brazil’s ethanol production is often lowest from January through March. Brazil often uses ethanol imports, typically from the United States, to fill the supply gap during this period. In past years, droughts in Brazil led to lower sugarcane harvest yields and corresponding increases in Brazil’s imports of ethanol to satisfy domestic demand.
In 2011, the combination of a relatively poor sugarcane harvest and high sugar prices resulted in lower ethanol production, which led to higher ethanol imports from the United States. U.S. fuel ethanol exports to Brazil increased in late 2017 and early 2018 in part because of U.S. ethanol pricing advantages and Brazil’s increasing ethanol-blending mandates.
Principal contributor: Natalie Kempkey
Tags: international, Brazil, liquid fuels, ethanol, oil/petroleum, biofuels