EIA’s residential energy survey now includes estimates for more than 20 new end uses
Results from the 2015 Residential Energy Consumption Survey (RECS) introduced estimates of energy consumption for an expanded list of energy end uses. For electricity, the number of end uses estimated has expanded from 4 to 26 by adding estimates for equipment such as dishwashers, clothes washers, clothes dryers, televisions, and lighting.
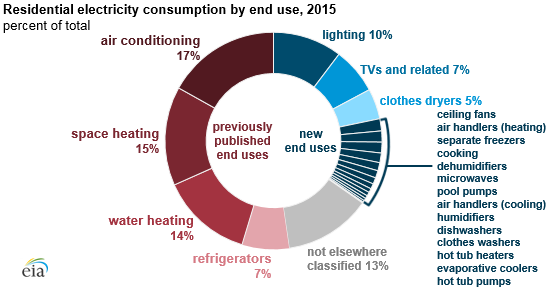
From 1990 through 2009, RECS estimated consumption and expenditures for four end-use categories: space heating, air conditioning, water heating, and refrigerators; the remainder was aggregated as other. As certain appliances and equipment have become more prevalent in homes, this remainder category became a larger share of residential energy consumption, especially for electricity.
In 2015, nearly half of residential electricity consumption fell into the other category. Adding several new characterizations of end uses provides a better accounting of energy use in homes, and now RECS attributes only 13% of residential electricity consumption to end uses not elsewhere classified.
The expanded end-use categories that consume electricity vary widely in how much energy they consume and how commonly they are found in the 118 million U.S. homes that are occupied as a primary residence. Lighting is used in all homes and consumes a substantial share of electricity—10% of the total electricity used in homes. Nearly every home had a television in 2015; about 3% of homes had no television. Televisions and their associated peripheral devices such as set top boxes and internet streaming devices use 7% of the electricity used in homes each year.
Other equipment is relatively less common but can account for a larger share of electricity consumption in the homes that have them. For example, only 7.9 million homes, or about 7% of the national total, reported using a pool pump. Nationwide, pool pumps consume 1% of the electricity used in homes, but among homes that have pool pumps, the equipment consumes 8% of total electricity used each year.
Refrigerator energy consumption and expenditures have been reported since the 1990 RECS. The 2015 estimates provide additional detail to this category, with separate estimates for the most-used and, in the homes that have them, the second-most-used refrigerator in a home. As a group, refrigerators use 7% of the electricity consumed. Most energy consumed for refrigeration is consumed by most-used refrigerators in homes (77%), with second refrigerators using 18% of total refrigeration consumption nationwide.
New estimates are also available for other common electric appliances, including clothes dryers (5% of total electricity consumption); microwaves (1%); dishwashers (1%); and cooking (1%), which collectively covers stoves, ovens, and cooktops. For dishwashers and clothes washers, the estimates cover only the electricity used to operate the equipment and not the energy used to heat the water drawn by these appliances; that energy would be accounted for in the estimate for water heating.
These end uses and several other itemized estimates collectively cover 87% of residential electricity use. The remaining category not elsewhere classified combines a number of end uses that are not publishable individually, such as computers, smartphones, and small kitchen appliances, as well as consumption from end uses not captured on the RECS Household Survey.
Before 2015, RECS surveys used statistical regression models to disaggregate a home’s energy consumption across the five published end uses. With the 2015 study, EIA transitioned to engineering models, which incorporate more equipment information and usage behavior from the RECS Household Survey as well as from research and equipment specifications, which produced improved estimates of energy consumption of devices in homes.
This improvement in methods for energy allocation affects comparisons with previous RECS. To assist data users interested in analyzing the time series of end-use consumption, EIA has published a brief report describing how this change in methodology has affected end-use estimates. EIA has also updated the methodology report for this survey to provide more information on the consumption data collection and end-use estimation approach.
More detail is also available for natural gas and propane end uses. For natural gas, the 2015 RECS provides expanded estimates for natural gas cooking, clothes dryers, pool heaters, and hot tub heaters. For propane, the new end uses detailed are clothes dryers and cooking. These data are available in tables as well as in a microdata file.
Principal contributors: Maggie Woodward, Chip Berry