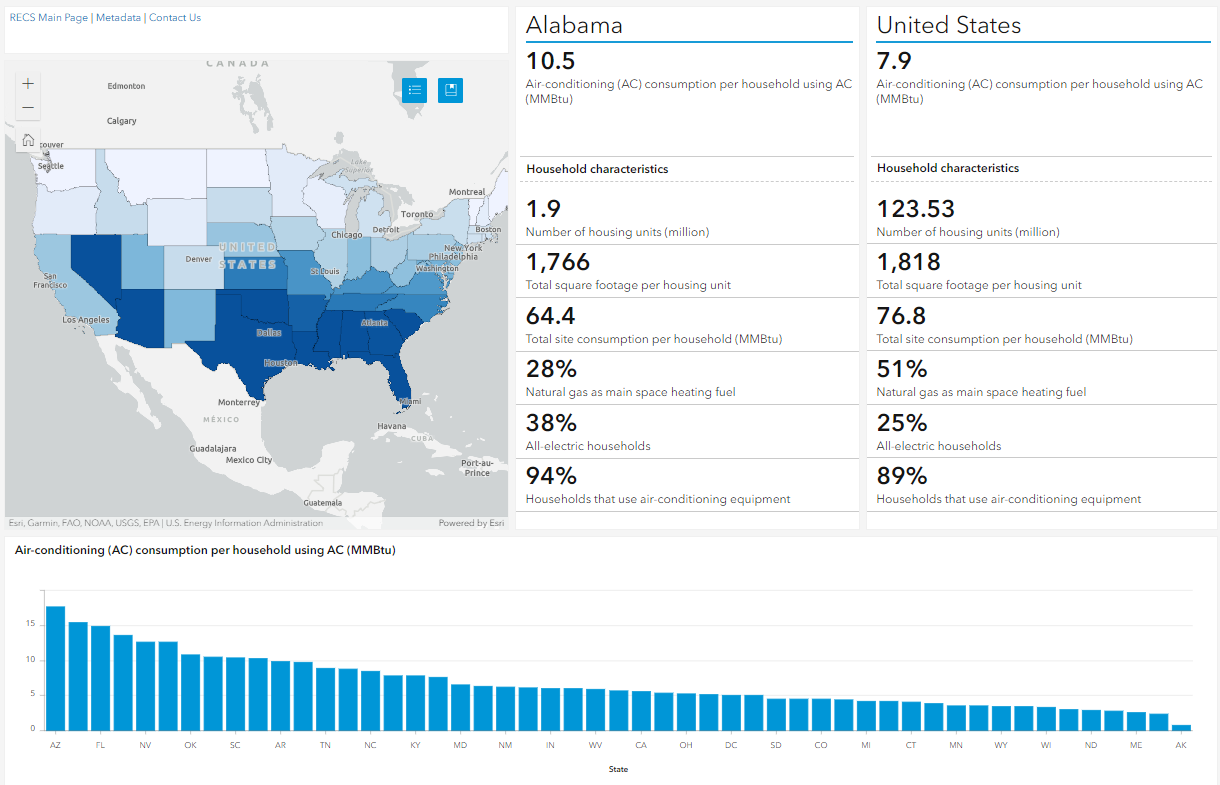
 View the dashboard ›

Introduction
This document describes differences between the 2015 Residential Energy Consumption Survey (RECS) and the 2009 RECS and previous studies, and compares RECS with estimates derived from external sources. Users should be aware of these differences when comparing estimates from one round of RECS to another, and when comparing RECS with other studies.
RECS is a periodic study conducted by the U.S. Energy Information Administration (EIA) that provides detailed information about energy usage in U.S. homes. RECS is conducted in two phases: phase one is the cross-sectional Household Survey that collects energy-related characteristics and usage patterns from a nationally representative sample of occupied primary housing units. Phase two is the Energy Supplier Survey (ESS), which collects billing data for responding households from their energy suppliers to allow EIA to estimate energy consumption and expenditures. Taken together, the housing characteristics data and the billing data are the basis for individual energy end-use consumption and expenditures estimates.
Users interested in additional information about RECS design and processes can consult technical documentation for the 2015 RECS Household Characteristics and 2015 RECS Consumption and Expenditures.
Comparing 2015 RECS and Previous RECS Studies
Each RECS is one in a series of independent cross-sectional studies of residential energy use. A longitudinal component, where the same housing units are sampled across cycles, has not been included in the RECS design since the 1990 RECS. Although each RECS shares many design elements with previous rounds, including most questions and processes, each study updates design elements based on program needs, resources available, and process improvements. As such, data users performing analysis across multiple rounds should consider where program updates might affect their analysis. Notable changes for the 2015 RECS that may impact comparisons with prior rounds are discussed here.
End-Use Modeling and Calibration Improvements
EIA began producing modeled, energy end-use estimates (e.g., space heating and air conditioning) as part of the RECS data series in 1980. End-use estimates from the 1980 RECS through the 2009 RECS relied on statistical regression models. All consumption was attributable to an end use, and each end use had its own model, which by construction contained at least one unknown parameter. The models became fully specified once the best (least squares) values for the unknown parameters were found using nonlinear regression. For each fuel, the annualized energy total was regressed on the sum of end-use models under constraints that certain parameters could not be negative (i.e., negative energy consumption is not allowed). The calibration method used was simple normalization, where the difference between the annualized ESS total and the modeled sum for a given housing unit was prorated over all end uses in the housing unit. In practice, every individually modeled end-use value for a given housing unit was multiplied by the same factor—the ratio of the ESS total to the sum of modeled end uses.
The 2015 RECS represents a substantial update to the end-use modeling and calibration methods. In the 2015 RECS, the end-use models follow an engineering approach, and the calibration—which follows a minimum variance estimation approach—is based on the relative uncertainties of and correlations between the end uses being estimated. Instead of estimating unknown parameters and interpreting their solution values as in statistical modeling, engineering models improve upon statistical models by drawing on existing studies. The engineering approach constructs physically principled models using published values for parameters, such as estimates for Unit Energy Consumption (UEC). And, unlike the statistical models, engineering models are independent and do not rely on the ESS data. The calibration improves upon simple proration by treating model estimates according to their assumed uncertainties, so the most uncertain estimates tend to receive the largest corrections while the least uncertain estimates tend to receive the smallest corrections.
The updated modeling and calibration methods are an improvement over previous RECS end-use estimation methods for the following reasons:
- End-use models in the 2015 RECS better reflect the expected energy consumption based on Household Survey characteristics data, using equations and parameter values from published sources.
- Engineering models lead to more realistic variations across modeled housing units.
- Calibration procedures in the 2015 RECS use minimum variance estimation, which better incorporates household characteristics data uncertainty and recognizes correlations between end uses.
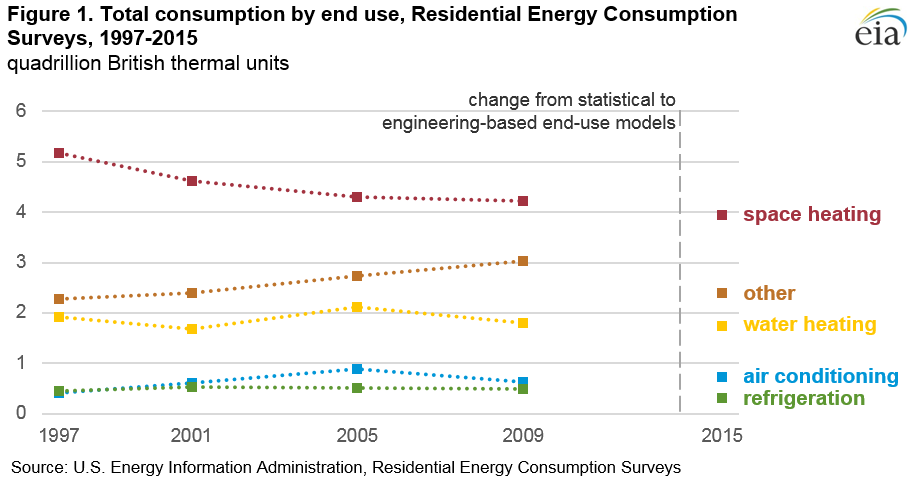
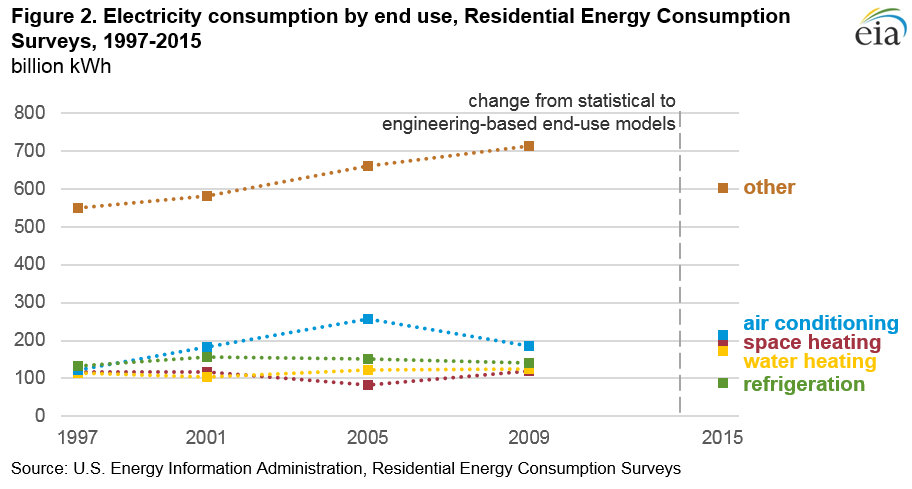
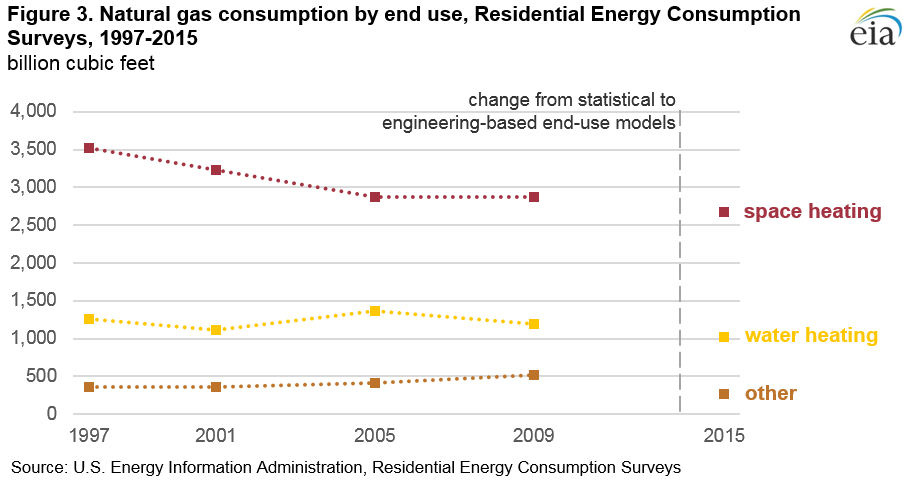
The following graphics show end-use estimate comparisons across selected RECS cycles for all fuels combined (Figure 1), electricity only (Figure 2), and natural gas only (Figure 3). Notably, the updated RECS end-use and calibration methods used in 2015 produced estimates of consumption of electricity for space heating and water heating that are higher than those in previous RECS, and estimates of refrigerators and other electricity consumption that are lower than in previous rounds.
Weather
Weather varies from year to year, but RECS energy consumption and expenditures estimates are not weather-normalized. In 2015, the U.S. population-weighted heating degree day (HDD) average was 9% lower than the HDD average in 2009. The 2015 U.S. population-weighted cooling degree day (CDD) average was 20% higher than the 2009 average.
Design and Process Changes
- Sample redesign: 2015 RECS estimates are based on responses from a smaller sample than the 2009 RECS. In 2015, 5,686 households responded to the RECS, which is less than half the size of the 12,083 completed interviews in the 2009 RECS. Smaller sample sizes generally result in higher standard errors, especially for estimates of smaller areas and subpopulations. In addition, the 2015 study drew a new sample of primary sampling units (PSUs), and the size and design of the PSUs were different from all previous rounds.
- Data collection mode changes: The 2015 RECS Household Survey relied extensively on self-administered web and paper questionnaires to supplement the traditional, computer-assisted personal interviews (CAPI). All three collection modes asked similar questions of each respondent, although the in-person interviews collected additional items, such as detailed questions about third refrigerators and third televisions. In addition, in-person interviews included a detailed measurement of the housing unit to produce a RECS-specific measure of square footage. No measurements were taken for web and paper cases and all square footage for those cases was imputed.
- Questionnaire changes: Aside from introducing web and paper modes for the 2015 RECS, EIA also improved and added questions to the Household Survey as part of the design improvements for the program. Questions about appliance usage, for example, were changed from categorical to open-ended responses, allowing for more precision.
- Data quality improvements: EIA introduced a quality-control step for the 2015 RECS that compared household characteristics responses with fuel billing and delivery data from energy suppliers. The additional editing step corrected some measurement error in the Household Survey where seasonal patterns in the consumption data contradicted fuel use responses in the Household Survey. That is, households misreported their main heating fuel and a correction was made based upon the billing data. As a result, 2015 RECS estimates for the number of households using electricity as main heating fuel are lower and estimates of natural gas are higher relative to previous rounds of RECS. In addition, there is more consistency between characteristics, annualized consumption and cost, and modeled end-use estimates.
- Consumption and expenditures annualization changes: The processes used to annualize monthly household billing and periodic fuel delivery data to the calendar reference year (January 1 to December 31, 2015) are similar to previous rounds with a few exceptions. Known vacant periods, for example, were imputed in previous rounds, but they were not imputed in 2015. EIA also reviewed the electricity data for all known solar PV households. Supplier data were removed and consumption was imputed for any electricity case where EIA determined that on-site generation data was not reported. This process ensured both delivered and on-site generated consumption were represented in total household consumption for these cases.
Comparing RECS with Other Studies
Other federal studies, including EIA's supply-side data collection programs, provide additional insight into residential energy demand. EIA, for example, conducts monthly and annual surveys of electricity suppliers and reports estimates of aggregate consumption for the residential sector (i.e., electricity retail sales.). In addition, independent measures from other federal household studies help relate the RECS estimates to key benchmarks, enhancing our understanding of energy consumers, housing units, and households.
The U.S. Census Bureau's American Community Survey (ACS) and the U.S. Department of Housing and Urban Development's American Housing Survey (AHS) collect energy characteristics about a few items similar to those in the RECS Household Survey. Each of these external studies is optimized to serve a different purpose from the RECS, and so their results for similar items may vary from the RECS. Below is a summary of comparisons with these external studies.
- EIA supply-side surveys (Forms EIA-176, EIA-857, EIA-861, EIA-861M, EIA-821, and EIA-877): EIA's electricity, natural gas, and petroleum offices conduct monthly, seasonal, and annual data collections to produce estimates of supply for these fuels disaggregated by energy demand sectors—residential, commercial, industrial, and transportation. These supply-side estimates reflect delivered consumption to each of these demand sectors. Although the supply-side surveys provide insight into total energy delivered to customers in specific sectors, the consumption surveys provide the view of demand within consuming units (e.g., housing units). RECS does not collect data or produce estimates for portions of the residential sector that are difficult or costly to survey, including vacant homes, seasonal homes, and common areas in apartment buildings. RECS total consumption and expenditures estimates, therefore, are expected to be lower than EIA's supply-side sector estimates.
- EIA's Annual Energy Outlook (AEO): EIA publishes projections of delivered energy consumption for each fuel and sector using the National Energy Modeling System (NEMS). The most recent RECS data, as well as a number of auxiliary data sources and technology reports, are used as inputs to the Residential Demand Module of NEMS. The AEO residential projections are estimates at the sector level, and RECS estimates are of occupied, primary housing units only. For these reasons, RECS and AEO estimates will differ.
- American Community Survey (ACS): The U.S. Census Bureau's ACS is an annual survey of more than three million U.S. households. The ACS questionnaire includes demographic and basic structural characteristics questions similar to those found on the RECS. Both surveys, for example, ask about housing unit type, age of home, main heating fuel, and household income. The final RECS counts of households by geographic region, housing type, and age equal ACS estimates because RECS household weights are post-stratified to those ACS estimates. Estimates for main heating fuel, however, will differ as a result of differences in question wording and additional quality checks (editing) that EIA conducted.
- American Housing Survey (AHS): The U.S. Department of Housing and Urban Development's AHS is a comprehensive, longitudinal study of the quality of living conditions and the housing stock. In addition to questions about fuel use and devices in homes, the AHS produces estimates of utility costs. Although these utility cost estimates are similar to RECS fuel expenditure estimates, AHS does not include costs for electricity, natural gas, and other fuels that are included in rents or condo fees.
Specific questions on this product may be directed to Chip Berry.