Tax credits and solar tariffs affect timing of projected renewable power plant deployment
The timing and magnitude of adding wind- and solar-powered electricity generators to the U.S. grid are sensitive to federal policies, especially federal tax credits that are currently scheduled to expire or diminish by 2022. In addition to the Reference case of EIA’s latest Annual Energy Outlook 2018 (AEO2018), which reflects current laws and regulations, three side cases show the potential effects of extending or eliminating certain tax credits. These cases also show the effect of the recently approved tariffs on imported solar photovoltaic (PV) cells and modules.
Federal tax credits available for renewable technologies have been modified and extended several times since their first enactment in 1992. In the most recent enactment, as part of the December 2015 budget reconciliation bill (H.R. 2029), Congress extended the qualifying deadlines and phaseout schedules for the Production Tax Credit (PTC) and the Investment Tax Credit (ITC).
For onshore wind and other PTC-eligible technologies, the PTC value in dollars per megawatthour began declining by 20% annually in 2017 and expires completely for projects starting construction after 2019.
EIA assumes that it takes four years to construct and bring wind plants online. As a result, wind plants entering service in 2020 will receive the full PTC value, and those entering service in 2022 will receive 60% of the full PTC value.
The 30% ITC for solar power also begins to decline in 2020, ultimately reaching 10% for utility-scale and commercial systems and expiring completely for residential systems by 2022. EIA assumes a two-year construction lead time for new utility-scale solar PV plants, so that plants entering service in 2019 receive the full 30% tax credit, but those entering service in 2022 only receive 26%.
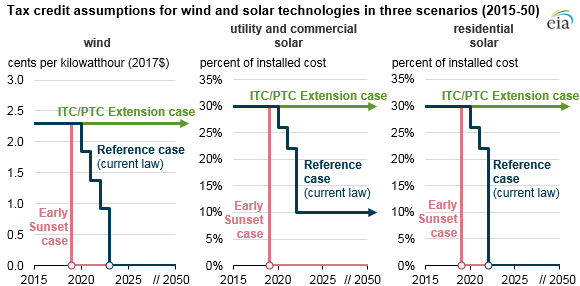
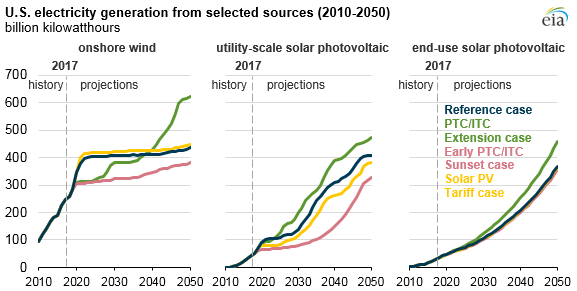
The PTC/ITC Extension case assumes existing tax credits are extended at the full credit value through 2050. The extension of the PTC/ITC results in a decline in new wind capacity installations relative to the Reference case in the near term, because wind projects built to take advantage of tax credits before they expire are built later in the projection period. With the continuation of the tax credits, wind generation continues to increase throughout the projection. By 2050, wind generation in the PTC/ITC Extension case is more than 40% higher than in the Reference case.
By contrast, the Early PTC/ITC Sunset case assumes existing tax credits expire in 2019. With an immediate sunset of the PTC, electricity generation from wind is lower than in the Reference case, but the market for new wind power plants continues to increase from current levels. By 2050, wind generation is 382 billion kilowatthours (kWh), an increase of 55% from 2017, but nearly 57 billion kWh lower than in the Reference case. In this case, the phaseout of the tax credit results in some wind projects being built earlier than market conditions would otherwise dictate in order to claim the credit.
Expiration of the tax credits in 2019 in the Early PTC/ITC Sunset case has a larger effect on utility-scale solar projects than on other renewable technologies, which results in 40% less solar generation on average between 2017 and 2050 than in the Reference case. However, by 2050, after continued growth of utility-scale solar installations in the Early PTC/ITC Sunset case, solar generation is 20% lower than in the Reference case.
The smallest change in electricity generation compared with the Reference case occurs in the Solar PV Tariff case, which examines the potential impacts of the recently passed 30% tariff on crystalline silicon PV cells and modules imported into the United States. The tariff is expected to start in 2018 and to be in effect for four years, declining by 5 percentage points annually until expiration. The 30% increase in module costs raises total installed costs by about 10%, as modules represent about one-third of total system costs for utility-scale systems.
The tariffs on solar PV are expected to have an even smaller impact on electricity generation from end-use solar installations. Because module costs account for a smaller percentage of total costs for end-use solar PV systems, residential and non-residential costs in 2018 are 4% and 6% higher, respectively, because of the tariffs.
The full Issues in Focus article Alternative Policies in Power Generation and Energy Demand Markets provides detailed discussions of the assumptions and results.
Principal contributor: Manussawee Sukunta
Tags: electricity, forecasts/projections, generation, renewables, solar, wind