
U.S. coal production, exports, and prices increased in 2017
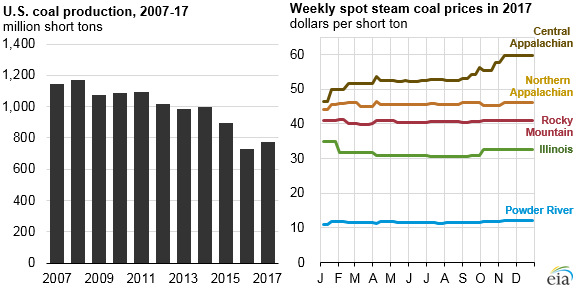
EIA expects total 2017 U.S. coal production to be 773 million short tons (MMst), 45 MMst higher than in 2016 and the largest year-over-year tonnage increase since 2001. Coal prices across the United States rose as well, especially for Central Appalachian coal. An increase in demand for U.S. coal exports more than offset a slight decline in U.S. coal consumption, contributing to higher coal production in 2017.
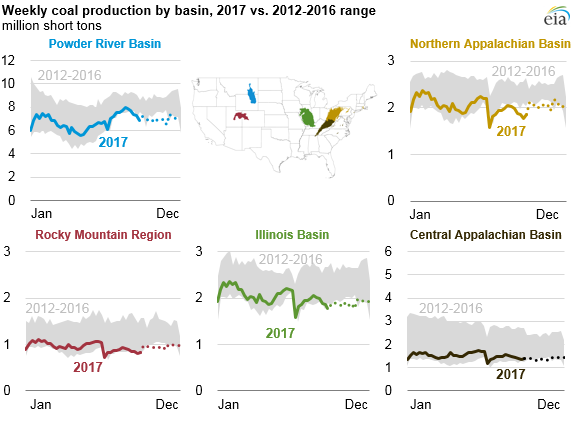
Note: Data for October 2017 through December 2017 are EIA weekly estimates based on coal railcars.
Coal production in 2017 in the United States was higher than in 2016 in each of the five major coal-producing regions. The largest regional increase in annual coal production was in the Powder River Basin, where production increased 8% (26 MMst) in 2017.
EIA attributes 2017 increases in U.S. coal production in part to the bankruptcy-caused restructuring of several major coal producers, which resulted in lower production costs. Even though U.S. coal consumption decreased, higher worldwide demand for U.S. coal led to greater coal production.
International demand for U.S. coal was driven by Asian and European countries. EIA expects total U.S. coal exports to reach 95 MMst in 2017, a 58% increase from 2016. Approximately 31 MMst of coal is expected to be exported to Asia in 2017, nearly double the volume exported in 2016. U.S. coal exports to Asia increased as China, Japan, and India looked to offset disruptions to their supplies of Australian coal caused by Cyclone Debbie in April 2017. Preliminary estimates show U.S. coal exports to Europe reaching 40 MMst in 2017, an increase of 13 MMst from the 2016 level.
EIA estimates that total coal consumption in the United States will be 719 MMst in 2017, slightly lower than the 731 MMst consumed in 2016. About 90% of domestic coal consumption is in the power sector, and despite higher natural gas prices in 2017, the coal share of total 2017 power generation is expected to be 30%, the lowest on record and lower than the natural gas share for the second consecutive year.
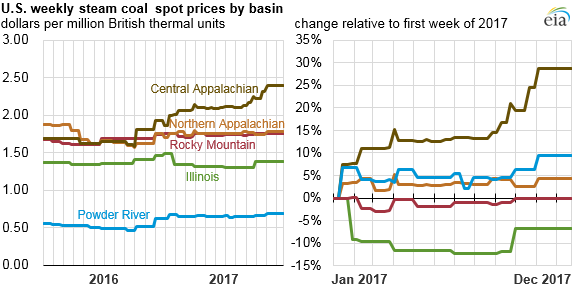
The average price of U.S. steam coal used in electricity generation increased in 2017 in several regions. The price of Central Appalachian coal, driven by strong domestic and international demand, continued an increase that started during the second half of 2016, rising by an additional 29% in 2017, which helped to drive the overall U.S. price increase. Powder River Basin and Northern Appalachian steam coal spot prices increased 4% and 10%, respectively, in 2017, continuing increases that started in mid-2016. In contrast, Rocky Mountain region coal prices remained flat, and Illinois Basin coal prices fell by 7%.
Principal contributor: Brian Park
Tags: coal, exports/imports, prices, production/supply