
EIA projects record winter household heating oil prices in the Northeast
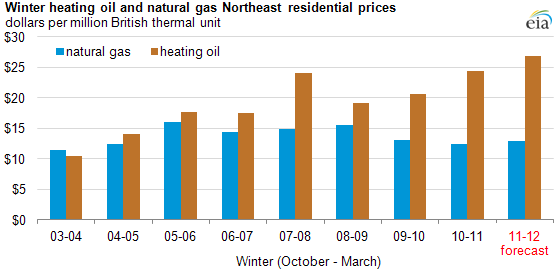
Note: The Northeast Census Region includes Maine, Vermont, New Hampshire, Massachusetts, Connecticut, Rhode Island, New York, New Jersey, and Pennsylvania. Prices for the two fuels are converted into common units of dollars per million Btu by dividing the retail heating oil price by its energy content of 0.139 million Btu per gallon and the residential natural gas price by its energy content of 1.03 million Btu per thousand cubic feet.
Download CSV Data
EIA projects that the average price paid by households in the Northeast this winter (October through March) for heating oil may be the highest ever, almost $27 per MMBtu ($3.71 per gallon) or more than double the projected average cost of natural gas ($12.93 per MMBtu) delivered to households in the Northeast.
The average price paid by households in the Northeast for heating oil more than doubled over the last seven winters, rising from an average of $10.48 per MMBtu ($1.45 per gallon) during the winter of 2003-04 to an average of $24.39 per MMBtu ($3.38 per gallon) during the winter of 2010-11. By contrast, the average household price of natural gas to households in the Northeast increased by only 7% over the same period, from $11.49 per MMBtu to $12.35 per MMBtu.
According to EIA projections in the October 2011 Short-Term Energy and Winter Fuels Outlook (STEO), residential heating oil prices this winter are expected to set a new winter record, averaging $26.77 per MMBtu ($3.71 per gallon), an increase of 10% over last winter. EIA expects Northeast residential natural gas prices to rise by 5% from last winter to $12.93 per MMBtu, still well below the peak $15.96 per MMBtu during the winter of 2005-06.
Heating oil prices largely reflect crude oil prices. For example, the average cost of crude oil to U.S. refiners increased from an average of $24 per barrel in 2003 to an average of $99 per barrel in 2011 (The October STEO produces this price using actual prices for January-September and forecast prices for October-December). Natural gas wellhead prices, however, which rose between 2003 and 2008, have fallen in recent years, in part due to the dramatic growth in natural gas production from unconventional shale gas resources. The estimated average natural gas wellhead price in 2011 of $3.85 per MMBtu is 19% lower than the $4.75 per MMBtu average in 2003.
Growing price differences in the Northeast between heating oil and natural gas appear to have affected consumers' selection of heating equipment. Since the winter of 2003-04, the number of households relying primarily on heating oil has declined, and conversely, the number of Northeast households relying mainly on natural gas heating has been going up (see chart below). Between the winters of 2003-04 and 2010-11, the number of Northeast households using natural gas heating increased by 651,000 (from 10.14 million to 10.80 million), while the number of households using heating oil fell by 1,197,000 (from 6.88 million to 5.68 million).
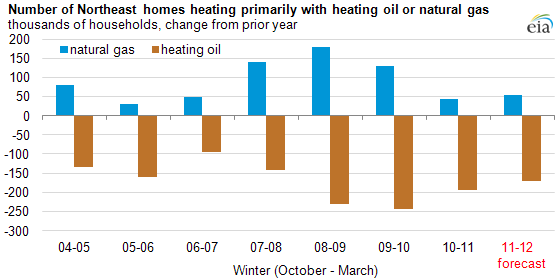
Note: The Northeast Census Region includes Maine, Vermont, New Hampshire, Massachusetts, Connecticut, Rhode Island, New York, New Jersey, and Pennsylvania.
Download CSV Data
Other highlights from the October 2011 Short-Term Energy and Winter Fuels Outlook (STEO) can be found in the 2011 Winter Fuels Outlook Slide Show.