
National average gasoline prices approach $3 per gallon heading into Memorial Day
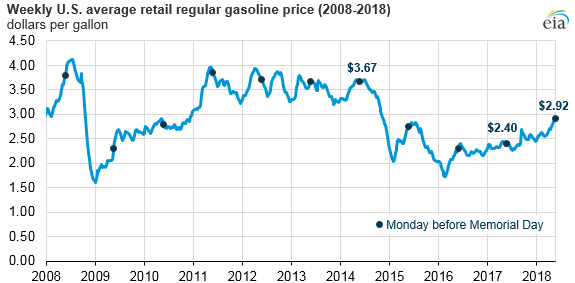
Heading into the 2018 Memorial Day weekend, regular gasoline prices averaged $2.92 per gallon (gal) nationally on May 21, up from last year’s price of $2.40/gal before the holiday weekend. This year marks the highest price ahead of the Memorial Day weekend since 2014, when the national average price of regular gasoline was $3.67/gal. Relatively higher crude oil spot prices, higher gasoline demand, and falling gasoline inventories are all factors contributing to higher gasoline prices.
EIA forecasts that gasoline prices will be higher this summer compared with last summer primarily because EIA expects Brent crude oil prices to average $22 per barrel (b) higher than during last summer. U.S. gasoline prices have been more closely tied to Brent crude oil prices than to West Texas Intermediate prices.
The Brent price averaged $78/b the week of May 18, 2018, or 51% higher than the same week in 2017. Because gasoline taxes and retail distribution costs have been generally stable, movements in gasoline and diesel prices have been mainly the result of changes in crude oil prices and wholesale margins.
EIA expects summer season (April through September) regular gasoline prices to average $2.90/gal in 2018, 49 cents higher than last summer. For all of 2018, EIA projects that U.S. regular gasoline prices will average $2.79/gal. The price of gasoline typically increases during spring because of the switch from winter-grade gasoline to the more expensive summer-grade gasoline. This year, the average price for regular gasoline has increased by 22 cents/gal (8%) since the start of the summer driving season in April.
U.S. gasoline consumption has remained relatively high, putting additional upward pressure on prices. As of May 11, 2018, the four-week average U.S. demand was 9.4 million barrels per day (b/d), about 1% higher than mid-May levels last year. AAA (in association with IHS Markit) expects more than 41.5 million Americans will travel this weekend, nearly 2 million more travelers than last year and the highest travel volume since 2005.
Decreasing gasoline inventories, including finished gasoline and gasoline blending components, are also contributing to the recent increase in gasoline prices. Although 2018 inventories are higher than the previous five-year average, they have remained lower than 2017 inventory levels for the past five weeks.
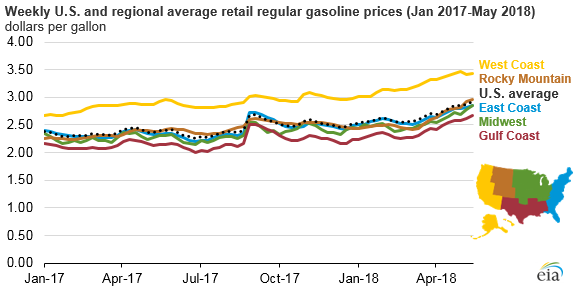
Retail gasoline prices can vary significantly within the United States because of regional supply and demand balances, gasoline specification requirements, and taxes. The West Coast region, defined by Petroleum Administration for Defense District (PADD) 5, typically has the highest retail gasoline prices in the country because of the region’s tight supply and demand balance, isolation from additional supply sources, and gasoline specifications that are more costly to meet. West Coast regional gasoline prices have been more than $3.00/gallon in each of the previous 20 weeks.
The Gulf Coast region (PADD 3) generally has the lowest retail gasoline prices in the country, because this region has more than half of the U.S. refining capacity and produces more gasoline than it consumes. Through May 21, average Gulf Coast gasoline prices are 27 cents/gal lower than the national average, and West Coast prices are 56 cents/gal higher.
Principal contributor: Kelsey Hallahan
Tags: prices, gasoline, liquid fuels, oil/petroleum