Australian domestic natural gas prices increase as LNG exports rise
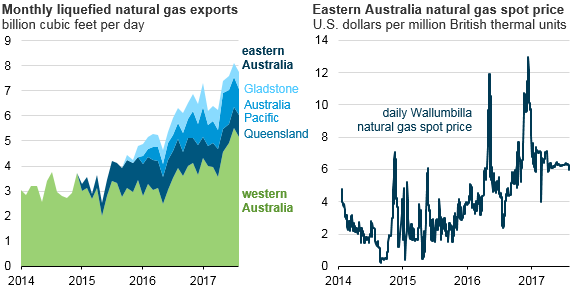
Australia became the world’s second-largest exporter of liquefied natural gas (LNG) in 2015 and is likely to overtake Qatar as the world’s largest LNG exporter by 2019. As Australia’s LNG exports have increased, primarily from LNG projects in eastern Australia, the country has had natural gas supply shortages in eastern and southeastern Australia and an increase in domestic natural gas prices.
The western and eastern parts of Australia have separate natural gas and electricity markets and are not interconnected. Five states in eastern Australia—South Australia, Queensland, New South Wales, Victoria, and Tasmania—account for 86% of Australia’s population, and in 2016, LNG exports from eastern Australia accounted for 43% of the country’s total LNG exports.
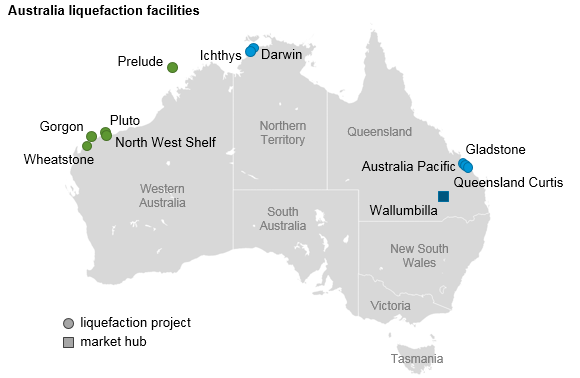
Three new projects in eastern Australia—Australia Pacific, Queensland Curtis, and Gladstone—all are located on Curtis Island in the state of Queensland and are associated with upstream production fields that provide natural gas produced from coalbed methane.
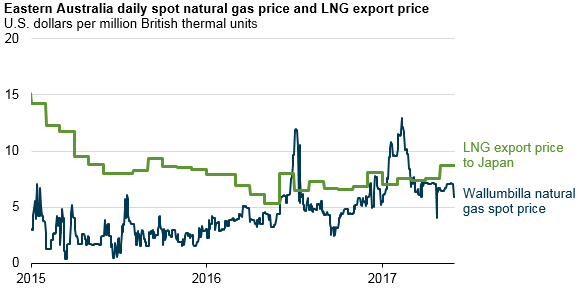
Since the start of LNG projects in Queensland, domestic natural gas prices at several hubs in eastern and southeastern Australia have more than doubled. Briefly in mid-2016 and again in early 2017, Australia’s domestic natural gas prices exceeded Australian LNG export prices to Japan, Australia’s largest destination for LNG exports, when domestic natural gas shortages caused price spikes in natural gas markets. LNG export prices, on the other hand, reflected lower prices in long-term contracts, which were linked to the price of crude oil. With the decline in crude oil prices, export contract prices for LNG also declined.
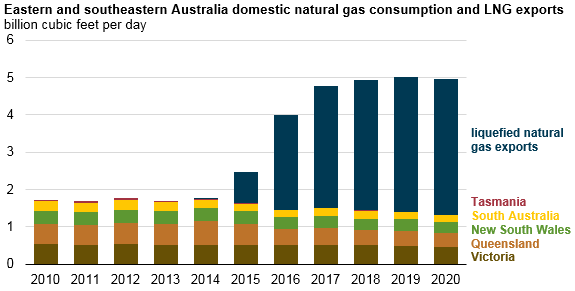
In 2016, natural gas consumption by LNG export projects in Queensland was almost twice as high as the total domestic consumption in eastern and southeastern states. Australia’s Energy Market Operator (AEMO) projected that LNG exports from these states will continue to grow through 2019 as these LNG projects ramp up to full capacity.
In September, the Australian Energy Market Operator, which manages the national electricity market for southeastern and eastern Australia and oversees electricity and natural gas retail markets and transmission, projected a natural gas supply shortfall in the domestic market of up to 0.27 billion cubic feet per day (Bcf/d) in 2018 and up to 0.26 Bcf/d in 2019.
On July 1, the Australian government established the Australian Domestic Gas Security Mechanism, which authorizes the government to limit LNG exports if companies are exporting more natural gas from Australia than they are supplying to the domestic market. This authority will stay in place through January 1, 2023. In September, three large LNG producers in eastern Australia—Royal Dutch Shell, Santos, and Origin Energy—reached an agreement with the federal government to guarantee natural gas supply to domestic customers to cover an estimated supply shortfall of 0.27 Bcf/d to avoid potential restrictions on LNG exports in 2018. The companies also agreed to sell natural gas produced in excess of contract volumes to the domestic market before selling it on global LNG spot markets.
The U.S. experience with growing LNG exports is unlikely to be similar to Australia’s. More than half of Australia’s total natural gas production was exported in 2016. Australia’s Energy Market Operator expects Australia’s LNG exports will account for 80% of domestic production by 2020. Despite the rapid LNG export capacity growth, EIA’s latest Annual Energy Outlook 2017 (AEO2017) Reference case—which reflects current policies and regulations—projects U.S. LNG exports to amount to only about 9% of total domestic natural gas production by 2020.
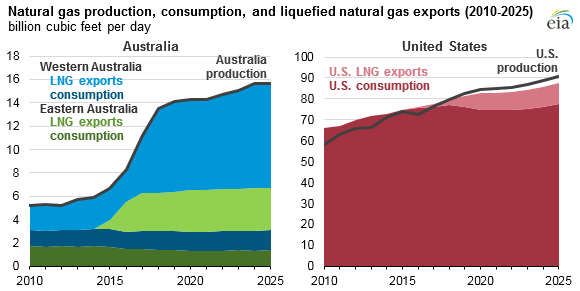
Note: Australia natural gas production/consumption balance includes 0.7 Bcf/d of natural gas imports.
Other differences between the natural gas markets in Australia and in the United States relate to each country’s LNG exports and domestic prices. Australia’s development of natural gas pipeline infrastructure that connects major production areas with more populated areas in eastern and southeastern Australia has been relatively slow compared with the extensive and growing pipeline infrastructure in parts of the United States that links producing and consuming regions. The United States also has considerably more natural gas storage infrastructure than Australia, which can help insulate markets from short-term supply disruptions that may lead to price spikes. In addition, estimates of natural gas reserves in eastern Australia have decreased in recent years, but U.S. natural gas reserve estimates have continued to grow.
Principal contributor: Victoria Zaretskaya