
Australia's Gorgon, one of the world's largest LNG terminals, ships first cargo
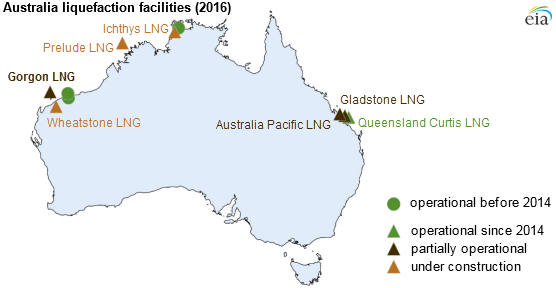
Australia's Gorgon project, one of the largest liquefied natural gas (LNG) projects in the world, shipped its first cargo last week to Japan. Located on Barrow Island off the coast of northwestern Australia, the project includes a domestic natural gas plant, a carbon dioxide injection project, and an LNG export facility. Its three liquefaction units, also known as trains, have a combined capacity of 2.1 billion cubic feet per day (Bcf/d). The first train was commissioned in March, with the second and third trains to follow at six- to nine-month intervals. The Gorgon project took more than six years to develop, with the original estimated capital costs of $37 billion U.S. dollars in 2009 growing to $54 billion by 2013, making it the world's most expensive LNG project to date.
Including the first train from Gorgon, Australia's LNG export capacity currently stands at 6.2 Bcf/d. If the additional LNG capacity currently under development is fully operational as planned by 2019, the country's LNG export capacity would likely increase to the largest in the world, at 11.5 Bcf/d, equivalent of one-third of global LNG trade in 2014.
Three projects in eastern Australia—Queensland Curtis, Gladstone, and Australia Pacific—have been fully or partially commissioned since 2014. Queensland Curtis commissioned its two trains in 2014-15, Gladstone commissioned its first train in October 2015, and Australia Pacific sent its first cargo in January of this year. All three projects process coalbed methane into LNG and have a current combined capacity of 2.3 Bcf/d. Once fully completed, they will have a combined capacity of 3.4 Bcf/d.
Gorgon LNG is the first of the four new projects off the northern coast of Western Australia to be partially commissioned. Three other projects in the northwest—Prelude, Wheatstone and Ichthys—are still under construction. These three projects have a combined capacity of 2.8 Bcf/d and are expected to come online in 2016-18.
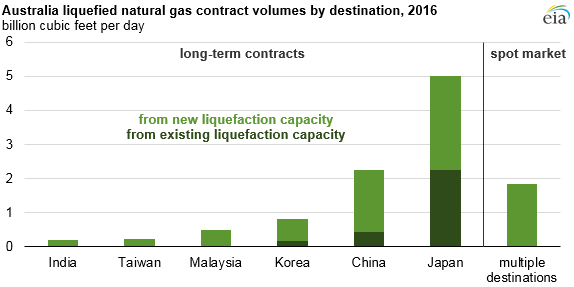
Most new Australian liquefaction capacity is contracted on a long-term basis to countries in the Asia Pacific region. Among destinations for Australian LNG, Japan accounts for the largest share of contracted liquefaction output, with contracts for 79% of output from the existing liquefaction projects (in operation prior to 2014) and 35% from the new projects. China is the second-largest destination, with 15% of contracted LNG from the existing liquefaction projects and 23% from the new projects. However, almost half of LNG contracted to China (about 1 Bcf/d) has flexibility in destination clauses. This flexibility allows buyers to take these volumes to countries other than China. In contrast, only 7% of LNG contracted to Japan (about 0.4 Bcf/d) is flexible and can be shipped to other countries. Almost 2 Bcf/d of the new Australian liquefaction capacity will be marketed on a spot basis.
Principal contributor: Victoria Zaretskaya
Tags: Australia, LNG (liquefied natural gas), map