California wholesale electricity prices are higher at the beginning and end of the day
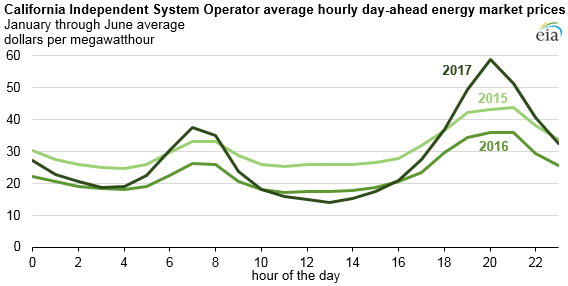
Note: Prices are simple averages of CAISO trading hubs ZP26, NP15, and SP15 from January 1 through June 30 of each year.
Comparisons of January through June day-ahead hourly electricity prices over the past three years in the California Independent System Operator (CAISO) energy market suggest a growing premium in certain morning and evening hours relative to midday hours. The higher hourly prices in the morning and evening hours reflect a premium for a particular characteristic that not all generators can deliver: the ability to increase output on command.
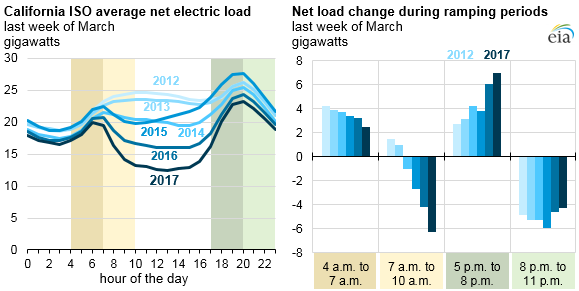
In the electric system, demand must always be met with sufficient generation to maintain grid reliability and to avoid blackouts. Historically, electricity generation was adjusted as customers turned appliances and equipment on and off around the same time each day. The morning and evening hours, when load is either ramping up or ramping down, are often the most challenging hours for grid operators, as they must ensure that the electricity supply changes to match the relatively rapid changes in demand.
Recently, the addition of both utility-scale and small-scale solar generators has contributed to steeper morning ramp-down and evening ramp-up periods. Other types of generating units decrease in the morning as solar generation increases with the sunrise and increase in the evening as the sun sets.
Flexible generators ramp up and down to follow net load, which reflects demand minus electricity generation from variable resources, such as solar and wind. Net load in CAISO has evolved over recent years. As more solar resources have been added, net load has increasingly fallen during midday when solar output is highest.
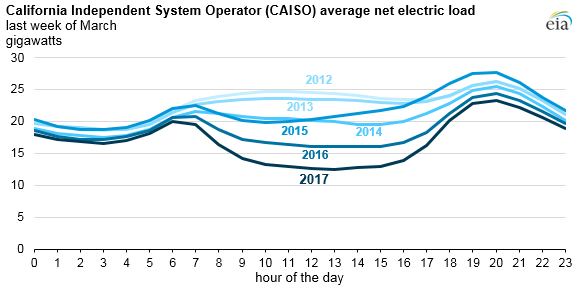
CAISO anticipated this evolution of the net load profile, often referred to as the “duck curve,” back in 2013. Load profiles from March were used as the reference for a typical spring day because seasonally low electricity demand makes the impact of solar and wind on net load more evident at that time of year.
Wholesale prices in CAISO’s day-ahead and real-time electricity markets, which do not directly determine retail rates, reflect dispatch decisions and are typically driven by the variable cost of the most expensive generation used to satisfy system load in a given hour. As the need for flexible generation that can operate during ramp periods has increased, wholesale prices in those hours have also increased.
Principal contributors: Lisa Cabral, Bill Booth, Chris Peterson