EIA electricity data now include estimated small-scale solar PV capacity and generation
Note: Capacity given in alternating-current megawatts (MWAC). See text box in this article for more information.
Small-scale distributed solar photovoltaic (PV) systems, such as those found on residential and commercial rooftops, have grown significantly in the United States over the past several years. Starting this month, the U.S. Energy Information Administration (EIA) is including monthly estimates of small-scale distributed solar PV capacity and generation by state and sector in EIA's Electric Power Monthly.
Although EIA has provided annual estimates of capacity and generation for small-scale PV systems at the national level in the Annual Energy Outlook for many years, it has not previously developed monthly state-level estimates for small-scale PV that could be integrated with EIA data for utility-scale generation and capacity.
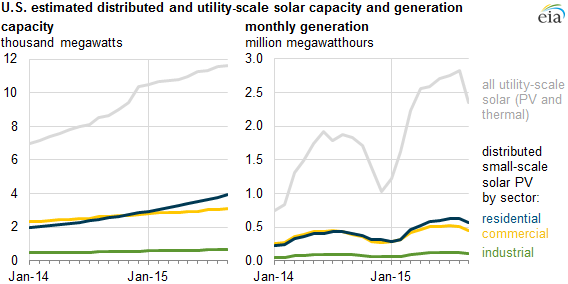
EIA estimates that total U.S. solar generation (PV and thermal) was 3.6 million megawatthours in September 2015, with 33% of that total coming from small-scale solar PV. Overall, U.S. solar generation, including both small-scale distributed PV and utility-scale PV and thermal solar generation, was equivalent to about 1.0% of total reported electricity generation from all utility-scale sources in September 2015.
Small-scale solar PV installations, defined by EIA as having capacity of less than 1 megawatt (MW), are usually located at the customer's site of electricity consumption. These small-scale PV installations are also called behind-the-meter, customer-sited, or distributed generation capacity. Although each distributed PV system is very small—a typical size for residential PV systems is 5 kilowatts (kW), or 0.005 MW—there are hundreds of thousands of these systems across the country that add up to a substantial amount of electricity generating capacity.
Almost 40% of the distributed PV capacity in the United States is located in California, with the next nine states accounting for another 44%. The remaining 40 states and the District of Columbia combined have the remaining 16%. California is not only the most populous state, but it is also home to other factors that encourage distributed PV generation: high electricity prices, strong solar resources, and state policies and incentives that support solar PV.
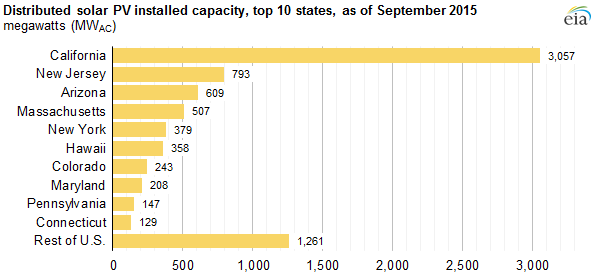
Other top states share some but not all of these factors. New Jersey, Massachusetts, and New York are top distributed solar states despite relatively less favorable solar resources because of consistent state solar PV policies and incentives and some of the highest residential electricity prices in the country. Other states, like Arizona, have incentive programs and strong solar resources. Hawaii has a small population, but its strong solar resources and high electricity prices make rooftop solar PV systems economically attractive.
EIA uses its surveys of electric utilities to collect information on the number of customers with distributed PV systems and the aggregate capacity of those systems. Because electric utilities do not necessarily know how much electricity is generated by rooftop PV on their distribution systems, generation from these systems must be estimated. To make comprehensive estimates of monthly generation for all small-scale solar PV at the state level, EIA developed methods that use the data it collects from electric utilities and third-party owners (TPOs) in conjunction with other information. TPOs are energy service providers that own rooftop PV systems located on customer premises and provide electricity directly to ultimate customers.
The National Renewable Energy Laboratory's System Advisor Model and PVWatts tools were used to develop estimates of generation for a number of weather locations around the United States and provided effective insolation data—essentially, how much solar energy reaches the PV systems—on a monthly basis. Data from the California Solar Initiative on commonly used tilt angles and orientations for PV systems were used as inputs to be representative of tilt angles and orientations in other states. Data reported to EIA on utility service territories and capacity were used to estimate monthly state generation. EIA's generation estimates were then compared with reported TPO data.
As shown below, estimated monthly generation rates for small-scale solar PV installations, measured as kilowatthours of generation per kilowatt (kWh/kW) of capacity, are almost identical to generation rates reported to EIA by TPOs. The clear seasonal pattern in generation rates reflects variation in solar irradiance, which is higher in the summer and lower in the winter.
Utility-scale solar PV systems have higher generation rates than small-scale solar PV systems, likely because of more favorable siting and orientation, better maintenance practices, and a higher proportion of systems with sun-tracking features that allow for increased generation.
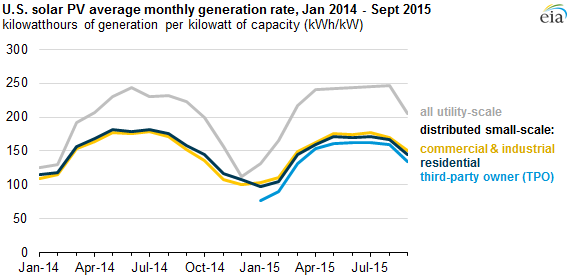
Note: Residential, commercial, and industrial generation rates are estimated. Utility-scale and TPO generation rates based on reported generation data.
Principal contributors: April Lee, Carolyn Moses