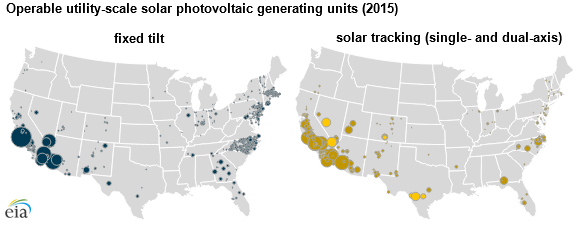
More than half of utility-scale solar photovoltaic systems track the sun through the day
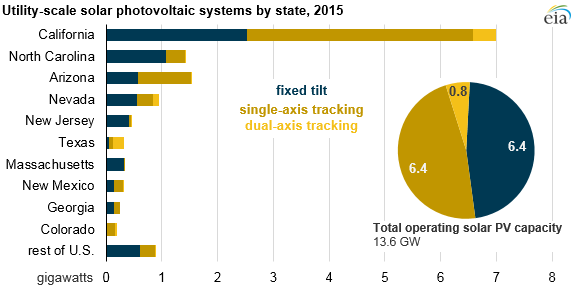
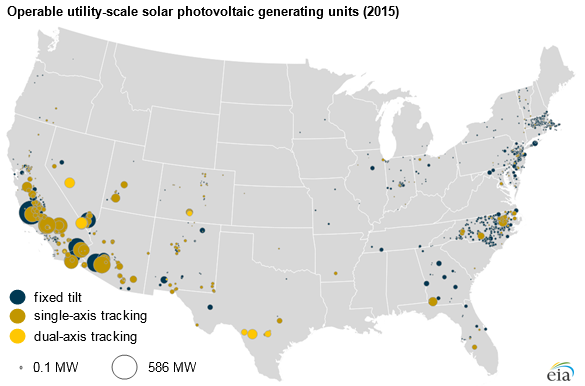
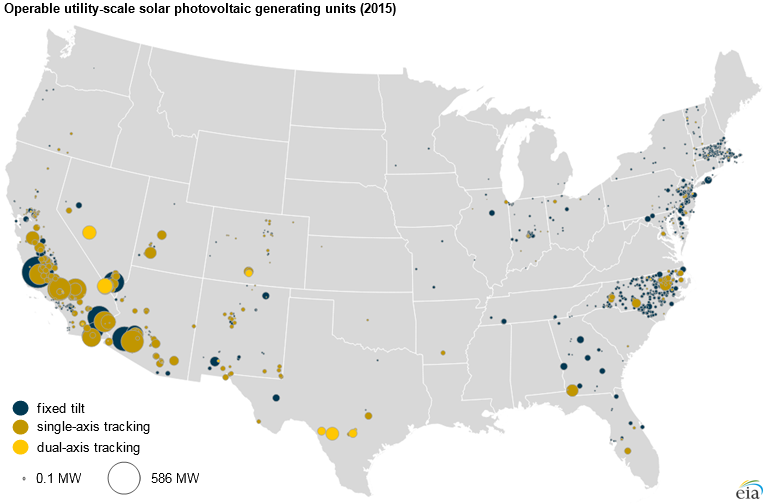
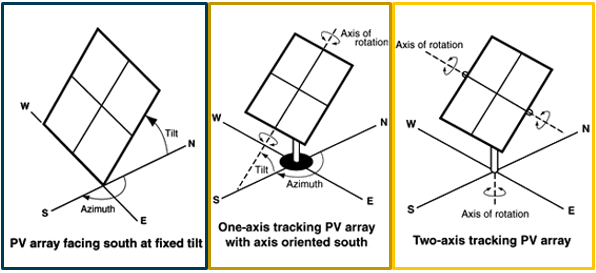
The electricity generated by a solar photovoltaic (PV) system depends on the orientation and tilt of the PV panels, and in some cases, its ability to track the sun throughout the day. Because photovoltaic panels operate more efficiently when oriented directly at the sun, some systems use solar-tracking technology to increase electricity generation by rotating the panels along one or two axes. More than 50% of the operating utility-scale solar PV systems in the United States use some form of tracking technology, and those systems tend to be located in the Southwest, where solar resources are more favorable.
EIA’s annual survey of electric generators captures detailed technology information about the nation’s power plants; the most recent report provides information as of the end of 2015. EIA’s monthly survey provides more recent, but less detailed, information on utility-scale power plants. Since the end of 2015, another 6.5 gigawatts of solar PV capacity has been added, based on data through January 2017.
Note: Click to enlarge.
Because of the cost of solar-tracking units and the differences in weather and solar insolation (exposure to the sun) across the United States, solar-tracking units may not be the most economic choice for producers in some regions. Fixed-tilt solar PV units accounted for 80%, or 2,468 megawatts (MW) of capacity, of all utility-scale solar PV units operating in 2015 in the eastern United States (i.e., east of the Mississippi River).
In states west of the Mississippi River, fixed-tilt solar PV units accounted for just 37% (3,904 MW) of total solar PV unit capacity in 2015, and single-axis solar PV units accounted for 56%. In comparison, single-axis units in the eastern region accounted for just 19% of solar PV capacity in the eastern United States.
The benefits of solar-tracking technologies depend on the amount and type of solar radiation. The two major types of solar radiation are direct-beam radiation and diffuse radiation. Direct-beam radiation comes from the sun to the earth in a straight line, whereas diffuse radiation is light that has been scattered by the earth’s atmosphere and strikes the earth’s surface in many different directions.
Solar-tracking technologies that follow the path of the sun across the sky are effective at capturing direct radiation because they can be aimed directly toward the sun. However, these tracking technologies have no benefit when capturing diffuse radiation because diffuse radiation is not concentrated in a certain trackable direction. The eastern United States has more average yearly cloud coverage than the western United States. As a result, the east receives higher proportions of diffuse radiation, reducing the benefits of tracking technologies and leading to a higher percentage of fixed-tilt solar panels. In the western United States, which receives more direct solar radiation, single-axis PV panels track the sun’s path from east to west, thus capturing more direct radiation than a fixed-axis unit.
Financial considerations also affect the choice between fixed-tilt mounting and the use of solar-tracking technology. Fixed-tilt units are cheaper to install than solar panels with tracking technology. Single- and dual-axis tracking units require additional acreage to install, and the tracking systems themselves are more expensive. However, tracking systems, while more expensive, can produce more electricity. For example, the PVWatts calculator developed by the National Renewable Energy Laboratory estimates that, over the course of a year, a 10-kilowatt PV system in Los Angeles, California, using a single-axis tracking system will produce 21% more electricity than a system tilted at a fixed 20 degrees. A dual-axis tracking system in the same location would produce 31% more than the fixed-tilt system.
Principal contributors: Sara Hoff, Jonathan DeVilbiss
Tags: electric generation, electricity, generation, map, solar