The API gravity of crude oil produced in the U.S. varies widely across states
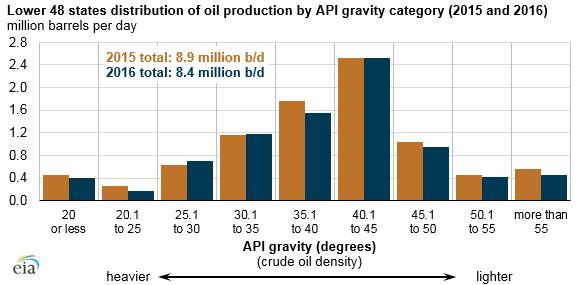
API gravity is one of the key characteristics of crude oil that, along with other characteristics such as sulfur content, is used by refiners when evaluating different crude streams for processing into petroleum products. In 2016, the majority (51%) of the 8.4 million barrels per day (b/d) of crude oil produced in the Lower 48 states was light oil, or less dense oil with an API gravity of 40.1 or above. Light oil also made up more than half of the oil produced in 2015.
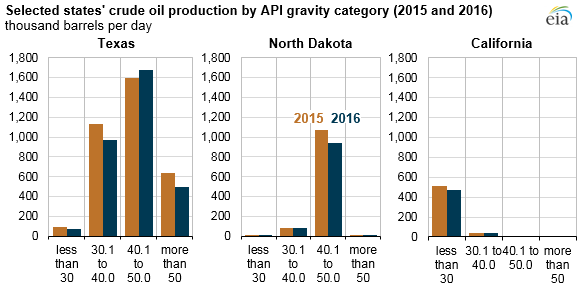
API gravity is measured as the inverse of the density of a petroleum liquid relative to water. The higher the API gravity, the lower the density of the petroleum liquid, so light oils have high API gravities. Based on the mix of their respective crude oil production streams, the distribution by API gravity of crude oils produced in Texas, North Dakota, and California differs significantly.
State-level data show the difference in crude oil API gravity in different parts of the country. For example, oil produced in Texas has a relatively broad distribution of API gravities, with most production ranging from 30–50 degrees API. Oil produced in North Dakota tends to be light (less dense). About 90% of North Dakota’s oil production has an API gravity of 40.1–50.0 degrees. California’s oil is mostly heavy (more dense), and more than 90% has an API gravity of less than 30 degrees.
Domestic crude oil production has grown rapidly since 2010, primarily because of light crude oil produced from low-permeability (tight) formations. EIA’s Annual Energy Outlook 2017 Reference case projects that U.S. tight oil production will increase in the coming decade, accounting for most of total U.S. oil production.
U.S. oil production increases over 2010–15 were driven by technological improvements that have reduced drilling costs and improved drilling efficiency in major shale plays such as the Bakken (North Dakota), Permian Basin (Texas and New Mexico), and Eagle Ford (Texas). The increased production in these areas has resulted in a greater share of Lower 48 production having an API gravity of 40 or higher.
EIA has now collected two years of API gravity data through its monthly survey of operators in major oil-producing states, which helps inform analysis of refinery inputs and utilization, crude oil trade, and regional crude oil pricing. EIA’s Monthly Crude Oil and Natural Gas Production Report collects production data from oil and natural gas well operators in 15 individual states and the Federal Offshore Gulf of Mexico.
Principal contributor: Emily Geary