Total U.S. energy production falls in 2016 after six consecutive years of increases
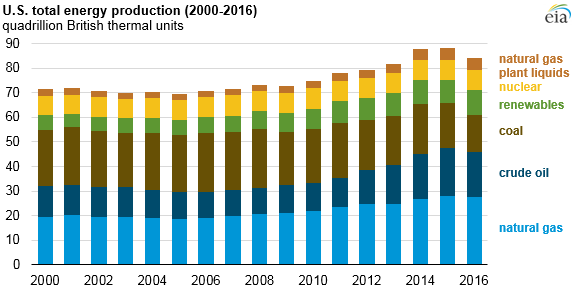
U.S. primary energy production totaled 84.1 quadrillion British thermal units (Btu) in 2016, falling 4% from the 2015 level, the first annual decline in U.S. energy production since 2009. The decline in production coincided with an increase in both total energy imports and exports.
U.S. fossil fuel production fell 7% from 2015 to 2016. Most of this decline was from coal production, which decreased 18% and fell to its lowest level since 1978. Relatively low natural gas prices, especially in the first half of 2016, and relatively flat electricity demand contributed to the decline in coal production. Petroleum and natural gas production also declined, falling 5% and 2%, respectively, as prices for both fuels were below their respective 2015 levels.
After declining slightly in 2015, U.S. renewable energy production increased 7% in 2016. Wind energy made up almost half the increase in renewable production, while solar energy accounted for nearly a quarter. Both fuels saw substantial electricity generating capacity additions in 2015 and 2016. Hydroelectricity also accounted for almost a quarter of the increase in renewable energy production, largely because of easing drought conditions in the West Coast states, where most of the U.S. hydroelectric capacity is located.
After ten consecutive years of decline, U.S. total energy net imports rose 6% from 2015 to 2016, as the growth in gross imports outpaced the increase in gross exports. U.S. gross energy imports increased 7% from 2015 to 2016. Most of the increase came from additional crude oil imports, which rose 7% as low gasoline prices led to an increase in gasoline demand.
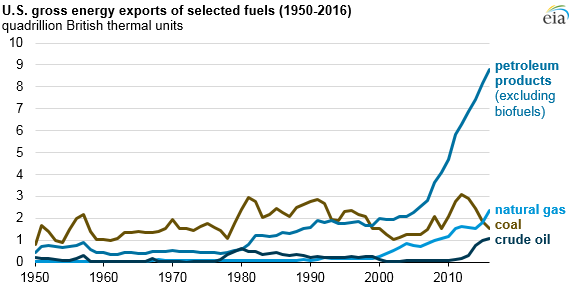
Despite the decrease in production, total energy exports rose 7% from 2015 to 2016. Petroleum product exports increased 8%, natural gas exports increased 30%, and crude oil exports increased 13%. These increases and relatively small changes in biofuels, electricity, and coal coke exports offset a 19% decline in coal exports.
For the first time on record, gross exports of natural gas from the United States exceeded those of coal in energy-equivalent terms. EIA projects that the United States will become a net exporter of natural gas on an annual basis by 2018, as domestic production continues to grow and additional natural gas export capacity, particularly to Mexico, comes online.
More information about total energy production, consumption, and trade is available in EIA’s Monthly Energy Review.
Principal contributor: Allen McFarland