Increase in rail shipments of propane, butane to West Coast offsets decreasing production
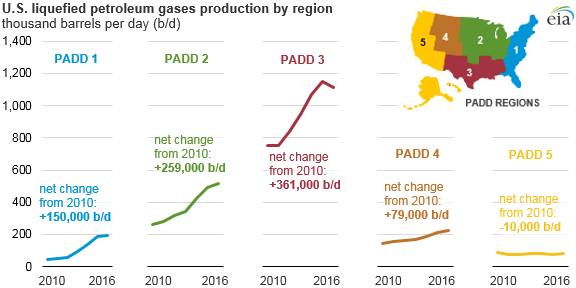
Total U.S. production of propane and butanes—commonly referred to as liquefied petroleum gases (LPG)—increased to 2.1 million barrels per day (b/d) in 2016. Production increased in all regions of the country except for the West Coast (Petroleum Administration for Defense District, or PADD 5). Unlike other regions, West Coast LPG production has been decreasing since 2010, driven by declining refinery production. Production in the region totaled 80,000 b/d in 2016, 10,000 b/d less than in 2010.
Much of the increase in U.S. LPG production has been driven by increasing production at natural gas processing plants, which has nearly doubled since 2010, reaching close to 1.8 million b/d in 2016. In the West Coast region, however, natural gas processing plant production stayed nearly flat at just less than 34,000 b/d in 2016. Relatively low levels of in-region production and a lack of LPG pipeline infrastructure have left the West Coast isolated from the LPG-related industrial growth that has occurred throughout the rest of the United States, especially along the Gulf Coast (PADD 3). As a result, rail shipments have become a growing means of transporting LPG to the region.
The increase in U.S. LPG production, along with relatively stable domestic demand, has created a growing surplus of LPG, which has resulted in increased exports since 2010. Between 2010 and 2016, LPG exports from the United States increased from 131,000 b/d to 908,000 b/d. Asia has become the primary destination for these exports, accounting for 44% of all volumes. Although the West Coast is just 14 days away by tanker from major East Asian ports, compared with 28 days away for exports out of the Gulf Coast, the West Coast accounted for just 6% of exports to these destinations, with the Gulf Coast making up the rest. Despite its relatively small share of growing U.S. exports, LPG export growth measured in absolute volumes from the West Coast to East Asian markets has drawn increasing supplies of Asia-bound LPG by rail into the region, especially from Canada.
Recently-released data show that in 2016, the West Coast received 46,000 b/d of LPG by rail from Canada and other PADDs, up from 16,000 b/d in 2010. At the same time, exports of LPG from the West Coast rose by nearly 5,000 b/d in 2016 to more than 37,000 b/d, and product ultimately exported to Asia accounted for most of the growth. The increased ability to transport LPG by rail has allowed Western Canadian producers, who can no longer ship LPG by pipeline to the Midwest following the repurposing and reversal of a key pipeline, to ship more LPG to the West Coast, where it can then be exported to overseas markets.
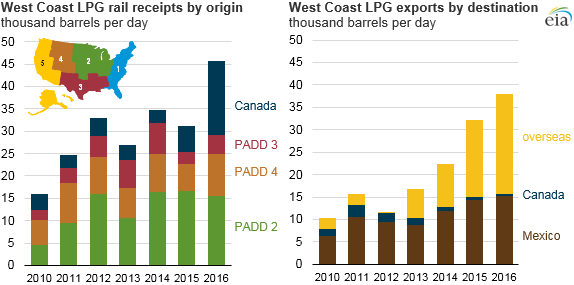
The West Coast only has one major LPG export terminal, and it currently accounts for nearly all overseas LPG exports. As LPG exports continue to increase, two other terminals on the West Coast have been proposed, but the permitting phase of development is not finished yet.
Principal contributors: Arup Mallik, Warren Wilczewski
Tags: Canada, exports/imports, natural gas, propane, rail, West Coast