Natural gas prices in 2016 were the lowest in nearly 20 years
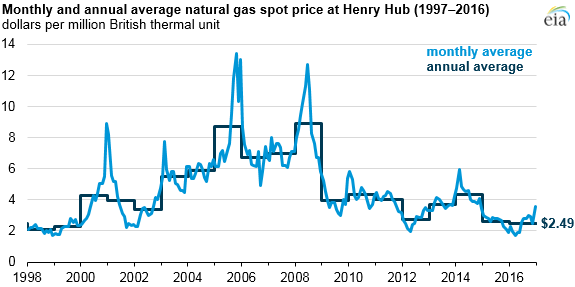
Natural gas spot prices in 2016 averaged $2.49 per million British thermal units (MMBtu) at the national benchmark Henry Hub, the lowest annual average price since 1999. The monthly average price fell below $2.00/MMBtu from February through May, but later increased, ending the year at an average of $3.58/MMBtu in December. Warmer-than-normal temperatures for most of the year and changing natural gas demand were the main drivers of natural gas prices in 2016.
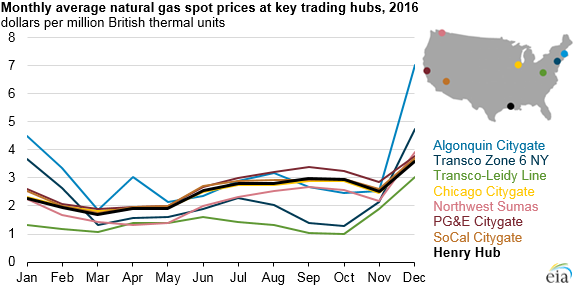
Natural gas prices in U.S. regional markets were volatile in 2016. In the first quarter of the year, much warmer-than-normal winter temperatures and large amounts of natural gas in storage caused prices to decrease. Prices began to gradually increase in late spring, with increased natural gas demand from multiple sectors and decreasing natural gas production, before sharply increasing at the end of the year with the onset of cold temperatures in mid-December.
In the Northeast, where natural gas pipeline capacity is often constrained, cold weather can cause monthly average prices at hubs such as Algonquin Citygate (near Boston) and Transco Zone 6 NY (New York) to spike. Although this happened in 2016, new pipeline capacity and increased natural gas production in the Appalachian Basin, along with warmer-than-usual winter weather, contributed to price spikes that were considerably lower than in previous years.
Because of warm weather, natural gas consumption in the residential and commercial sectors in 2016 declined 7% and 4%, respectively, from the previous year. Warmer winter temperatures also limited natural gas storage withdrawals. As a result, natural gas storage inventories were at or near record levels throughout most of the year and reached a record 4,047 billion cubic feet (Bcf) for the week ending November 11.
Despite the overall decrease in residential and commercial demand in 2016, late-year increases in these sectors and increased demand from other sources contributed to increasing natural gas prices later in the year. In 2016, natural gas surpassed coal as the primary fuel used for power generation in the United States, supplying an estimated 34% of the nation’s electricity, compared with 30% for coal. Electric power generation in 2016 used an average of 27.6 billion cubic feet per day (Bcf/d), exceeding the previous high of 26.3 Bcf/d in 2015.
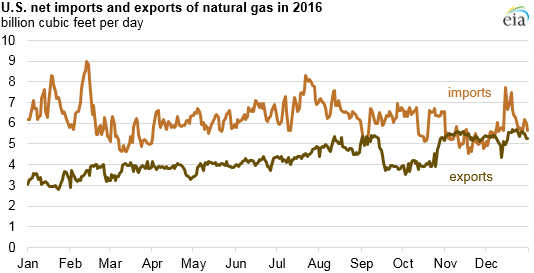
In November 2016, the United States became a net exporter of natural gas on a monthly basis for the first time since 1957, based on data from PointLogic. This was supported by infrastructure improvements—including natural gas pipelines and facilities for liquefying natural gas for export—that enabled suppliers to meet increasing demand from foreign markets.
U.S. pipeline exports to Mexico continued to grow throughout 2016, making up 87% of all U.S. natural gas exports. In May 2016, the Sabine Pass liquefaction terminal began commercial operations in the Gulf Coast to export liquefied natural gas (LNG). The expansion of the Panama Canal in July 2016 further aided export ability by reducing time and transportation costs to key markets in Asia and the west coast of South America.
Despite growing demand in the electric power sector and export markets, low demand for space heating and low prices resulted in lower natural gas production in 2016. Based on preliminary data, EIA estimates natural gas marketed production to average 77.5 Bcf/d in 2016, 1.3 Bcf/d less than in 2015 and the first annual decline since 2005. The number of active natural gas drill rigs continued a multi-year decline, reaching 132 by the end of 2016, down 19% from the year-ago count. However, production has not fallen as sharply as the number of active rigs, as producers have continued to make gains in drilling efficiency.
Principal contributors: Kristen Tsai, Jason Upchurch