
Colonial Pipeline restarts Line 1, resumes gasoline shipments to U.S. Southeast
Note: Click to enlarge.
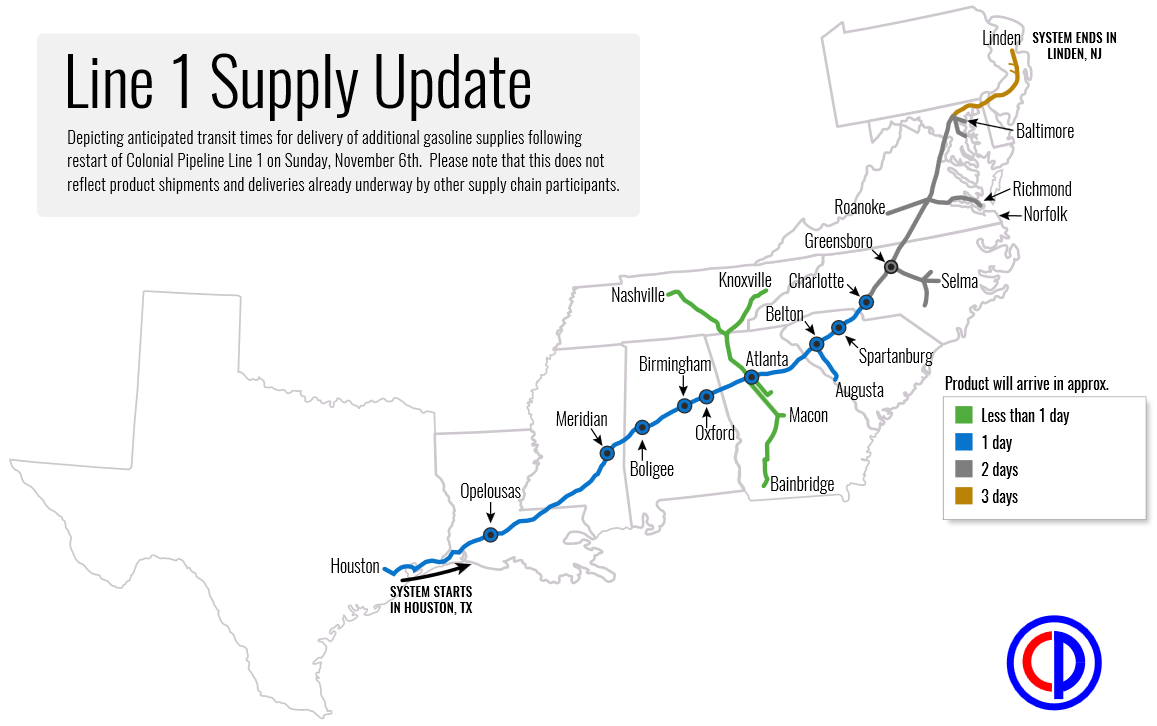
Following an outage that began on October 31, Colonial Pipeline's Line 1 resumed shipping gasoline early Sunday morning. Line 1 carries gasoline from the Gulf Coast to as far east and north as North Carolina and is a key supply source for several states in between and beyond. When operating at full capacity, Line 1 carries 1.4 million barrels per day of gasoline from the U.S. Gulf Coast to a major junction and product storage hub in Greensboro, North Carolina. Various branches provide gasoline to central and eastern Tennessee, southern Georgia, and eastern and western portions of Virginia. Beyond Greensboro, other portions of Colonial's system send gasoline, diesel, and other transportation fuels to Maryland and New Jersey.
According to Colonial Pipeline, gasoline is expected to reach as far north as Charlotte, North Carolina within a day of Line 1's restart. Gasoline shipments on Colonial's system are expected to reach as far north as Baltimore, Maryland, by Tuesday and to reach their northern terminus in Linden, New Jersey, near New York Harbor, by Wednesday.
Total motor gasoline stocks in the Lower Atlantic states (defined by Petroleum Administration for Defense District, or PADD, 1C) were at relatively high levels before the October 31 outage, with 27.5 million barrels, or nearly 20% above the previous five-year average, in storage as of October 28. Inventory data for the week ending November 4 will be available on Wednesday, November 9 in EIA's Weekly Petroleum Status Report.
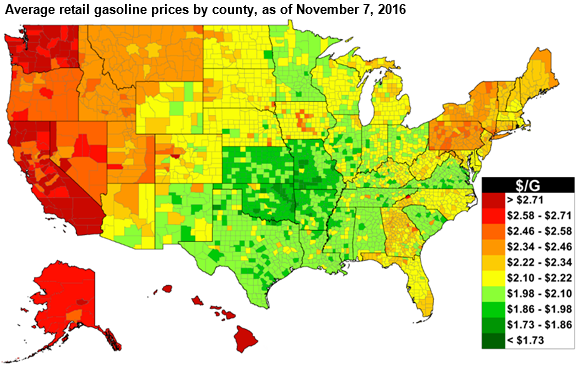
Despite the recent outage, GasBuddy, a crowd-sourced retail gasoline price comparison site, showed retail prices in most areas in the Southeast below $2.35 per gallon (g) as of November 7. EIA's weekly retail price for regular gasoline for the Lower Atlantic (PADD 1C) was $2.17/g as of Monday, November 7, virtually unchanged from the previous week, and 6 cents/g below the national average.
A previous disruption to Line 1 flows from September 9 through September 21 resulted in record changes in motor gasoline stocks in both the Lower Atlantic states and the Gulf Coast states during the week ending September 16. During that week, total motor gasoline stocks in PADD 1C fell by nearly 6 million barrels, from 28 million barrels to 22 million barrels. Meanwhile, Gulf Coast (PADD 3) gasoline stocks increased by nearly 4.8 million barrels. In the week ending September 23, stocks grew modestly in both regions, indicating that resupply had begun to reach the Lower Atlantic region.
Principal contributor: Hannah Breul
Tags: disruption, gasoline, liquid fuels, map, pipelines, prices