Menu
Crude oil, gasoline, heating oil, diesel, propane, and other liquids including biofuels and natural gas liquids.
Exploration and reserves, storage, imports and exports, production, prices, sales.
Sales, revenue and prices, power plants, fuel use, stocks, generation, trade, demand & emissions.
Energy use in homes, commercial buildings, manufacturing, and transportation.
Reserves, production, prices, employment and productivity, distribution, stocks, imports and exports.
Includes hydropower, solar, wind, geothermal, biomass and ethanol.
Uranium fuel, nuclear reactors, generation, spent fuel.
Comprehensive data summaries, comparisons, analysis, and projections integrated across all energy sources.
Monthly and yearly energy forecasts, analysis of energy topics, financial analysis, congressional reports.
Financial market analysis and financial data for major energy companies.
Greenhouse gas data, voluntary reporting, electric power plant emissions.
Maps, tools, and resources related to energy disruptions and infrastructure.
State energy information, including overviews, rankings, data, and analyses.
Maps by energy source and topic, includes forecast maps.
International energy information, including overviews, rankings, data, and analyses.
Regional energy information including dashboards, maps, data, and analyses.
Tools to customize searches, view specific data sets, study detailed documentation, and access time-series data.
EIA's free and open data available as API, Excel add-in, bulk files, and widgets
Come test out some of the products still in development and let us know what you think!
EIA's open source code, available on GitHub.
Forms EIA uses to collect energy data including descriptions, links to survey instructions, and additional information.
Sign up for email subscriptions to receive messages about specific EIA products
Subscribe to feeds for updates on EIA products including Today in Energy and What's New.
Short, timely articles with graphics on energy, facts, issues, and trends.
Lesson plans, science fair experiments, field trips, teacher guide, and career corner.
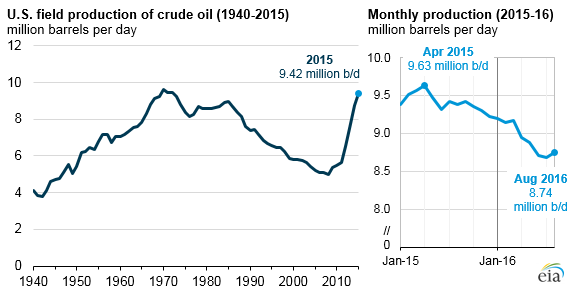
U.S. field production of crude oil increased in 2015 for the seventh consecutive year, reaching 9.42 million barrels per day (b/d). This was the highest crude oil production level since 1972, based on final production numbers in EIA’s Petroleum Supply Annual. In 2015, production gains were highest in Texas, the Gulf of Mexico, and North Dakota, as these three regions accounted for 77% of the U.S. total increase. Although annual production for 2015 grew, monthly U.S. crude oil production has declined since April 2015. Lower oil prices led to slower development activity, and production fell to 8.74 million b/d in August 2016, the latest month for which survey data is available.
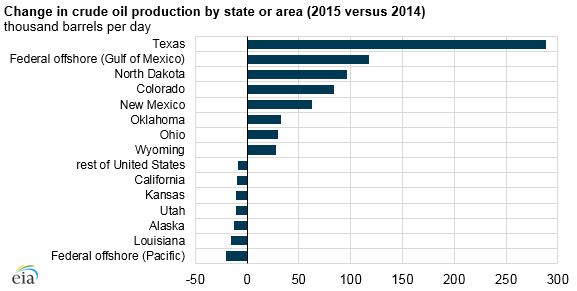
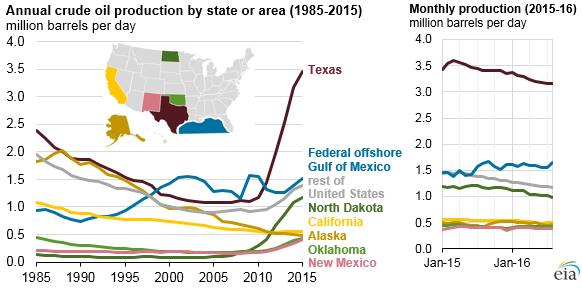
States or areas with the highest volumes of production also saw the largest gains in 2015. Texas is by far the largest crude oil-producing state, providing 3.46 million b/d in 2015, the highest level since at least 1981, when EIA’s state-level production series begin. Production in Texas grew by 289,000 b/d in 2015, the largest increase of any state. The Federal offshore region of the Gulf of Mexico was second in both absolute level and 2015 increase, growing by 118,000 b/d to reach 1.52 million b/d, the highest production in that area since 2010. Production in North Dakota was third in both absolute level and 2015 increase, growing by 96,000 b/d to reach 1.18 million b/d, the highest on record for the state.
California production has generally declined since 1985—when it was 1.08 million b/d—and averaged 0.55 million b/d in 2015. Alaska’s crude oil production, almost all of which is in the North Slope, fell for the thirteenth consecutive year, declining to 0.48 million b/d in 2015.
Principal contributor: Owen Comstock
Tags: Alaska, California, crude oil, Gulf of Mexico, liquid fuels, North Dakota, oil/petroleum, production/supply, states, Texas