
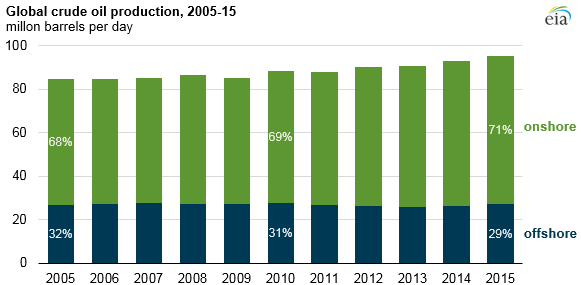
Offshore production nearly 30% of global crude oil output in 2015
Note: Includes lease condensate and hydrocarbon gas liquids.
Republished 5:30 p.m. Tuesday, October 25, to clarify that oil production discussed here includes lease condensates and hydrocarbon gas liquids.
Global offshore oil production (including lease condensate and hydrocarbon gas liquids) in 2015 was at the highest level since 2010, and accounted for nearly 30% of total global oil production. Offshore oil production increased in both 2014 and 2015, reversing consecutive annual declines from 2010 to 2013. Production from onshore tight oil plays has increased faster over the past several years and accounts for an increasing amount of total oil production.
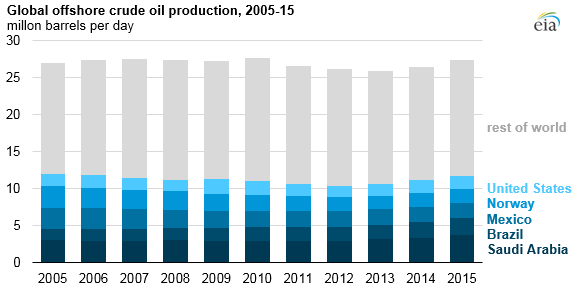
More than 27 million barrels of oil were produced offshore in 2015 in more than 50 different countries. Global oil production is expected to remain high in 2016, as many oil-producing nations continue to increase production. A significant amount of global offshore production is concentrated in a few countries. In 2015, five countries provided 43% of total offshore oil production: Saudi Arabia, Brazil, Mexico, Norway, and the United States.
Note: Includes lease condensate and hydrocarbon gas liquids.
Saudi Arabia. The world’s largest offshore producer has several large offshore oil fields including the Safaniya oil field, which produces between 1.1 and 1.5 million barrels per day and is the highest-producing offshore field in the world. Saudi Arabia is responsible for 13% of the world’s total offshore production.
Brazil. Offshore production grew by 58% between 2005 and 2015, making Brazil the second-largest offshore producer in 2015. This growth was driven predominately by the expansion of deepwater pre-salt projects, which should support small production increases in 2016 and 2017.
Mexico. The third-largest offshore producer has seen increasingly smaller yields from offshore assets, with production falling by 31% from 2005 to 2015. Mexico, however, still produced nearly 2 million barrels per day in 2015, accounting for 7% of global offshore production.
Norway. Although offshore production declined 28% from 2005 to 2010, it has remained steady since 2010, with 7% of global offshore production originating from Norwegian fields. Norwegian output is forecast to rise slightly in 2016 and to fall slightly in 2017.
United States. Recent strong production in the Gulf of Mexico has increased offshore production. From 2005 to 2015, total offshore production grew by 6.5%. With several large projects coming online in 2016 and 2017, the Gulf of Mexico is expected to see production climb by about 0.1 million barrels per day (b/d) in 2016 and by an additional 0.2 million b/d in 2017. By contrast, U.S. onshore production is expected to fall by 0.8 million b/d in 2016 and by an additional 0.3 million b/d in 2017.
Most offshore production is in shallow waters, which are cheaper and less technically challenging, but there has also been a move toward deepwater projects. Exploratory drilling in deeper water is more costly and complex for companies, but technology advancements and the exhaustion of shallower prospects have led companies to explore increasingly deeper waters, particularly in Brazil and in the Gulf of Mexico.
Principal contributor: Matthew Manning