New EIA website spotlights key drivers of petroleum product prices
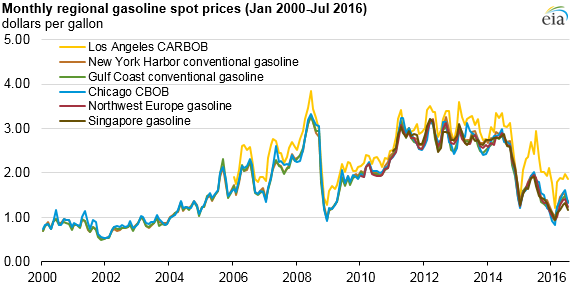
Note: CBOB is conventional blendstock for oxygenate blending. CARBOB is California reformulated gasoline blendstock for oxygenate blending.
The U.S. Energy Information Administration recently released the What Drives Petroleum Product Prices website that identifies and tracks several fundamental and financial market factors that influence spot and futures prices of gasoline and distillate, the two most consumed petroleum products in the United States. This website offers charts that highlight changes in consumption, production, inventories, and trade, mostly related to the U.S. domestic market along with some charts that include global indicators. The website, a complement to the existing What Drives Crude Oil Prices website, will be updated monthly in conjunction with the Short-Term Energy Outlook.
The new website shows how global petroleum product prices move in relation to each other. In the long term, global petroleum product prices tend to move together because these products can be transported between markets, which links the supply and prices of these products. In the near term, however, factors such as product specifications, refinery maintenance schedules, unplanned refinery outages, transportation constraints, consumption seasonality, and regional inventory levels can result in diverging price trends.
For example, gasoline prices in California often diverge from domestic and international gasoline prices because of the state's unique gasoline specifications and the relative isolation of the California gasoline market. In 2015, when the refinery in Torrance, California (then owned by ExxonMobil, now owned by PBF Energy), experienced a severe, unplanned outage, gasoline prices increased sharply in that region.
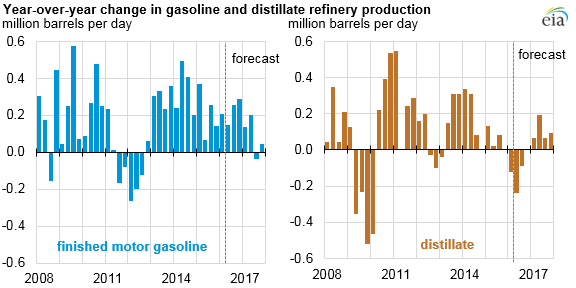
The new website also tracks changes in gasoline and distillate production. Over the past year, refineries increased gasoline output because in 2015 and early 2016, the relative production value of gasoline for refineries was high. Distillate production declined year-over-year in the first quarter of 2016—the first time since 2013—and is expected to continue declining through the third quarter of 2016, while gasoline production is projected to rise year-over-year through 2016.
Increased gasoline production contributed to high gasoline inventories, which in recent months negatively affected the relative value of producing gasoline, referred to as a crack spread. Crack spreads compare differences in crude oil and petroleum product prices and can serve as estimates of refining margins. The new website provides users with charts that track both gasoline and distillate crack spreads using futures contracts.
In June 2016, the front-month futures contract of reformulated blendstock for oxygenate blending (RBOB, the petroleum component of gasoline used in many parts of the country) averaged $1.56 per gallon (gal), and the Brent crude oil front-month futures contract averaged $1.19/gal ($49.93 per barrel, divided by 42 gallons per barrel), resulting in a crack spread of 37 cents/gal. The RBOB-Brent crack spread in June 2016 was significantly below the June 2015 level and is slightly below the five-year average.
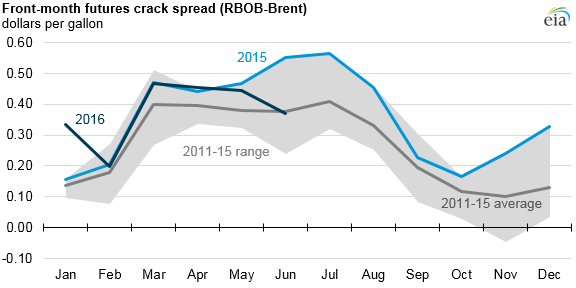
Note: RBOB is reformulation blendstock for oxygenate blending.
In addition to these charts, the What Drives Petroleum Product Prices website enables users to track the relationship between gasoline and distillate prices and inventory levels, to see which regions in the United States primarily import or export these products, and to compare open interest and volume in gasoline and distillate futures contracts.
Principal contributor: Rebecca George