
Crude oil shipments by rail from Midwest to coastal regions decline
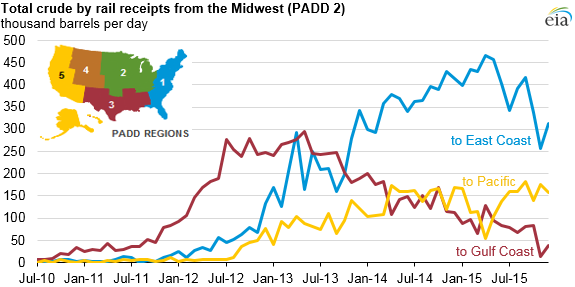
The movement of crude by rail within the United States, including within Petroleum Administration for Defense Districts (PADDs), reached a high of 928,000 barrels per day (b/d) in October 2014, with most of the shipments originating in the Midwest and going to the East Coast, West Coast, and Gulf Coast regions. Since October 2015, crude-by-rail volumes have declined as production has slowed, as crude oil price spreads have narrowed, and as more pipelines have come online.
The economics of moving crude by rail depend largely on significant domestic crude discounts compared with international crudes. Because domestic crudes such as West Texas Intermediate (WTI) and Bakken, which are priced at Oklahoma and North Dakota, respectively, are no longer priced significantly less than waterborne crudes such as North Sea Brent, there is less of a cost advantage for costal refineries to run the domestic crudes. The narrower the spread between domestic and imported international crude, the more likely costal refineries will choose to run imported crudes rather than domestic supplies shipped by rail.
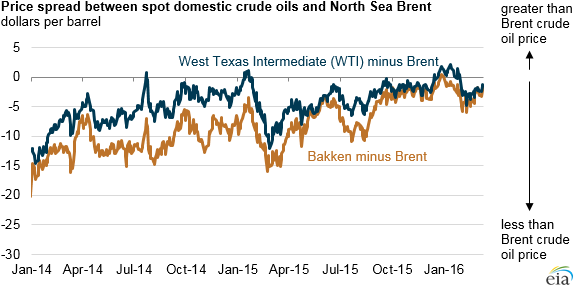
Crude supplies carried by rail from the Midwest to the East Coast (PADD 2 to PADD 1) continue to be the largest rail movement, accounting for 50% of total crude oil moved by rail within the United States in December 2015, the latest month for which data are available. However, this flow has been trending downward since reaching 465,000 b/d in April 2015. With a narrowing price spread between domestic and imported crude oil, imports of crude oil to the East Coast, particularly from countries in western Africa, have grown. Increased runs of imported crude in East Coast refineries have reduced the need for rail shipments of domestic crude oil to that region.
The next largest crude-by-rail movement is from the Midwest to the West Coast, which typically goes to refineries in the Pacific Northwest. Although movements from the Midwest to the West Coast fell in the early part of 2015 during planned and unplanned refinery outages, deliveries resumed when refineries restarted in late spring. The West Coast received an average of 139,000 b/d of crude oil by rail from the Midwest in 2015, roughly comparable with 2014 levels.
Movements of crude by rail from the Midwest to the Gulf Coast (PADD 2 to PADD 3) formed the largest inter-PADD rail movement from 2011 to 2013. Midwest-to-Gulf Coast rail movements started to decline in the second half of 2013 as new and expanded pipeline capacity came online. As additional pipeline capacity was added throughout 2013–15, crude-by-rail movements to the Gulf Coast from the Midwest continued to decline, dropping to 38,000 b/d in December 2015, 75,000 b/d less than in the previous year. Other crude oil-producing regions, such as the Niobrara in the Rocky Mountains (PADD 4) and the Permian Basin in Texas and New Mexico (part of PADD 3) also experienced growth in pipeline takeaway capacity to the Gulf Coast refining centers, reducing the need for railed crude supply from the Midwest.
Continued pipeline takeaway expansions and interconnections with existing pipelines in crude-producing regions such as the Bakken and the Gulf Coast will further reduce the need for intra-PADD rail flows within the Midwest and the Gulf Coast, as well as inter-PADD rail flows from the Midwest to the Gulf Coast. However, no crude oil pipeline infrastructure currently exists to move crude to the East and West coasts from the Midwest. Therefore, future crude-by-rail flows from the Midwest to the coasts will depend on the price dynamic between domestic and international crudes, as well as any long-term contractual volume commitments made by refiners.
Principal contributor: Arup Mallik, Mason Hamilton