New EIA monthly data track crude oil movements by rail
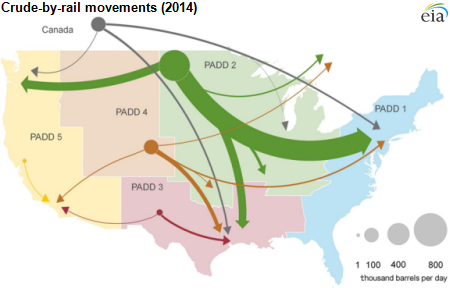
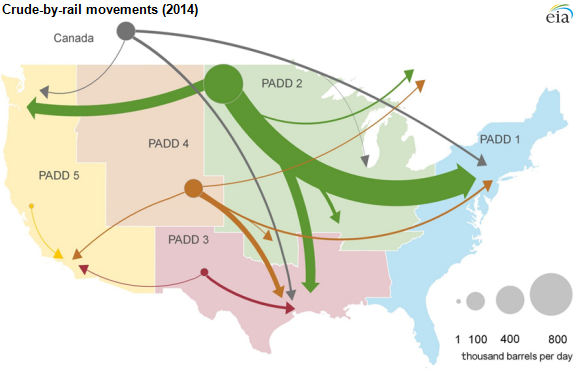
Note: Crude-by-rail movements greater than 1,000 barrels per day are represented on the map; short-distance movements between rail yards within a region are excluded. PADD denotes Petroleum Administration for Defense District.
For the first time, EIA is providing monthly data on rail movements of crude oil, which have significantly increased over the past five years. The new data on crude-by-rail (CBR) movements are integrated with EIA's existing monthly petroleum supply statistics, which already include movements by pipeline, tanker, and barge. The new monthly time series of crude oil rail movements includes shipments to and from Canada and dramatically reduces the absolute level of unaccounted for volumes in EIA's monthly balances for each region.
EIA is initiating the new series with monthly data from January 2010 through the current reporting month, January 2015. CBR activity is tracked between pairs of Petroleum Administration for Defense District (PADD) regions (inter-PADD), within each region (intra-PADD), and across the U.S.-Canada border. EIA developed the new series using information provided by the U.S. Surface Transportation Board (STB) along with data from Canada's National Energy Board, and EIA survey data.
Total CBR movements in the United States and between the United States and Canada were more than 1 million barrels per day (bbl/d) in 2014, up from 55,000 bbl/d in 2010. The regional distribution of these movements has also changed over this period.
The maps below provide general flows of CBR movements annually from 2010 through 2014.

Source: U.S. Energy Information Administration based on data from the Surface Transportation Board and other information
Note: Crude-by-rail movements greater than 1,000 barrels per day are represented on the map; short-distance movements between rail yards within a region are excluded.
The Williston Basin in North Dakota (PADD 2) was the primary origin of 55,000 bbl/d of CBR shipments in 2010, with most shipments remaining in the Midwest region. Rail tank cars were used mainly to move Bakken crude oil to the Cushing, Oklahoma, storage and pipeline hub. The remaining volumes of Bakken CBR shipments went to Gulf Coast and East Coast refineries (PADDs 3 and 1, respectively).
Source: U.S. Energy Information Administration based on data from the Surface Transportation Board and other information
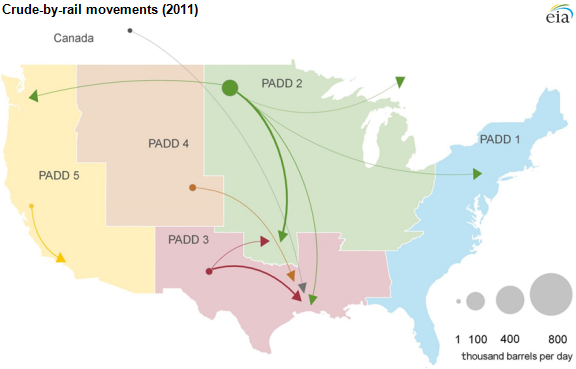
Note: Crude-by-rail movements greater than 1,000 barrels per day are represented on the map; short-distance movements between rail yards within a region are excluded.
Total CBR shipments were 124,000 bbl/d in 2011, more than double the 2010 level. The Bakken formation in PADD 2 remained the primary source of CBR shipments in 2011. Movements within PADD 2 and from PADD 2 to PADD 3 (Gulf Coast refineries) accounted for most of the shipments. PADD 2 to 3 volumes grew 36,000 bbl/d (more than 400%). Bakken crude-by-rail shipments to refineries on the East and West coasts both increased more than 200% from the previous year while Bakken crude to West Coast refineries increased by more than 400%.
Source: U.S. Energy Information Administration based on data from the Surface Transportation Board and other information
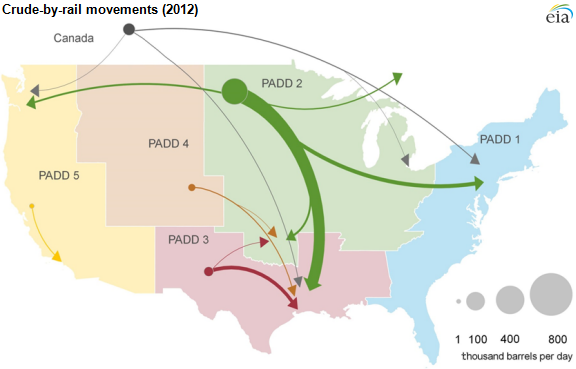
Note: Crude-by-rail movements greater than 1,000 barrels per day are represented on the map; short-distance movements between rail yards within a region are excluded.
The total volume of CBR shipments more than tripled from the previous year, reaching 440,000 bbl/d. Almost all of the growth came from PADD 2 shipments to other regions of the country. The largest flow was from PADD 2 to PADD 3, with rail substituting for a lack of available pipeline capacity to carry crude oil to Gulf Coast refineries. PADD 2 crude-by-rail shipments to East Coast and West Coast refineries continued to grow, as did Western Canadian crude-by-rail to U.S. refineries. Niobrara crude from PADD 4 started moving by rail to Gulf Coast refineries.
Source: U.S. Energy Information Administration based on data from the Surface Transportation Board and other information
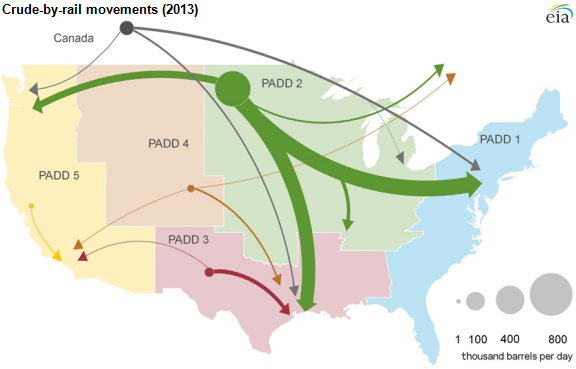
Note: Crude-by-rail movements greater than 1,000 barrels per day are represented on the map; short-distance movements between rail yards within a region are excluded.
Total CBR movements nearly doubled again, reaching 816,000 bbl/d in 2013. Gulf Coast refineries (PADD 3) received 352,000 bbl/d, or 43% of all crude moving by rail. Bakken crude from PADD 2 to coastal refineries dominated CBR shipments in 2013. Movements were affected by major construction efforts to complete unit train loading and unloading terminals.
Source: U.S. Energy Information Administration based on data from the Surface Transportation Board and other information
Note: Crude-by-rail movements greater than 1,000 barrels per day are represented on the map; short-distance movements between rail yards within a region are excluded.
Growth in total CBR movements slowed in 2014, but the average CBR volume exceeded 1 million bbl/d. Bakken crude from PADD 2 continued to dominate flows, making up 70% of CBR volumes. Niobrara crude from PADD 4 grew in importance as the second-largest origin for rail shipments. East Coast refineries (PADD 1) were the primary destination for CBR receipts in 2014.
For more information on EIA's CBR data, visit the new U.S. Movements of Crude Oil By Rail webpage.
Principal contributors: Arup Mallik, Katie Teller