Menu
Crude oil, gasoline, heating oil, diesel, propane, and other liquids including biofuels and natural gas liquids.
Exploration and reserves, storage, imports and exports, production, prices, sales.
Sales, revenue and prices, power plants, fuel use, stocks, generation, trade, demand & emissions.
Energy use in homes, commercial buildings, manufacturing, and transportation.
Reserves, production, prices, employment and productivity, distribution, stocks, imports and exports.
Includes hydropower, solar, wind, geothermal, biomass and ethanol.
Uranium fuel, nuclear reactors, generation, spent fuel.
Comprehensive data summaries, comparisons, analysis, and projections integrated across all energy sources.
Monthly and yearly energy forecasts, analysis of energy topics, financial analysis, congressional reports.
Financial market analysis and financial data for major energy companies.
Greenhouse gas data, voluntary reporting, electric power plant emissions.
Maps, tools, and resources related to energy disruptions and infrastructure.
State energy information, including overviews, rankings, data, and analyses.
Maps by energy source and topic, includes forecast maps.
International energy information, including overviews, rankings, data, and analyses.
Regional energy information including dashboards, maps, data, and analyses.
Tools to customize searches, view specific data sets, study detailed documentation, and access time-series data.
EIA's free and open data available as API, Excel add-in, bulk files, and widgets
Come test out some of the products still in development and let us know what you think!
EIA's open source code, available on GitHub.
Forms EIA uses to collect energy data including descriptions, links to survey instructions, and additional information.
Sign up for email subscriptions to receive messages about specific EIA products
Subscribe to feeds for updates on EIA products including Today in Energy and What's New.
Short, timely articles with graphics on energy, facts, issues, and trends.
Lesson plans, science fair experiments, field trips, teacher guide, and career corner.
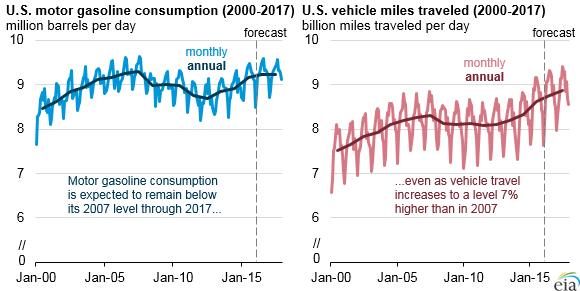
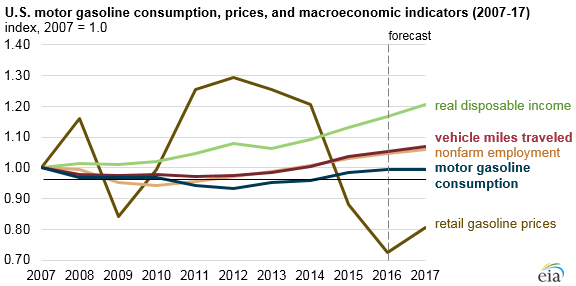
Based on estimates in the most recent Short-Term Energy Outlook (STEO), vehicle travel in the United States in 2015 was almost 4% above its 2007 level, but motor gasoline consumption has not exceeded its previous peak in 2007. Improvements in light-duty vehicle fuel economy are largely responsible for this outcome.
STEO forecasts motor gasoline consumption to average 9.23 million barrels per day (b/d) in both 2016 and 2017, about 0.6% below its 2007 level. In contrast, vehicle travel is expected to grow to levels 5% and 7% above the 2007 level in 2016 and 2017, respectively.
Lower gasoline prices and changes in the economy affect growth in vehicle travel. Projected growth in vehicle travel remains consistent with increases in macroeconomic indicators such as nonfarm employment and real disposable income. The combination of an increasing share of the baby-boomer generation reaching retirement and continued increases in vehicle fuel economy is expected to limit growth in motor gasoline consumption for the forecast interval and beyond.
Principal contributor: Michael Morris
Tags: consumption/demand, gasoline, transportation