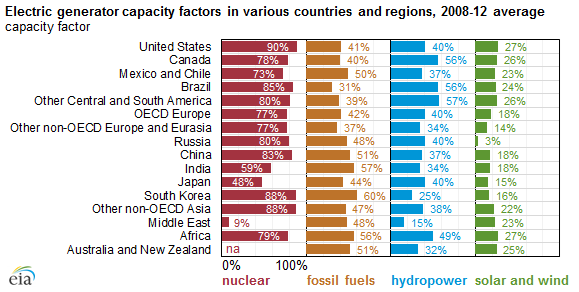
Electric generator capacity factors vary widely across the world
Note: Capacity factors reflect actual generation as a percent of continuous operation at full capacity. Capacity factors from the five-year period are weighted using their annual capacities and averaged. For regions with missing capacity factors for some years, only existing capacity factors are used to calculate a five-year weighted average.
Reposted December 23, 2015 to enhance description of capacity factors.
The technologies used to generate electricity are similar across regions of the world, but the pattern of use for those generating technologies can be significantly different. Analysis of electric generating plant utilization (measured by annual capacity factors, or the ratio of generation to capacity) over a five-year period shows a wide range of variability among fuel types and across world regions.
These differences in annual capacity factors can be attributed to a wide range of factors:
- Differences in daily load patterns, which reflect the mix of demand from buildings and industry, among other factors
- Differences in operating costs, mainly driven by fuel costs
- Planned and unplanned outages of units to meet regulatory and maintenance requirements
- Variation in the efficiency of electric generating technologies using the same fuel type
- Constraints due to resource availability commonly associated with generators relying on renewable resources.
Capacity factors can also be affected by partial-year generation effects, especially for technologies with recently installed capacity. By convention, the numerator of the capacity factor is based on actual generation, while the denominator is based on what that generator could have provided, assuming continuous operation for a full year. Projects built in the second half of the year will only have a few months of generation to report, resulting in capacity factors lower than expected for a full year of operation. The data presented here reflect the five-year average ending in 2012, the most recent year with both generation and capacity data for all geographic areas discussed.
Note: Capacity factors reflect actual generation as a percent of continuous operation at full capacity. Capacity factors from the five-year period are weighted using their annual capacities and averaged. For regions with missing capacity factors for some years, only existing capacity factors are used to calculate a five-year weighted average.
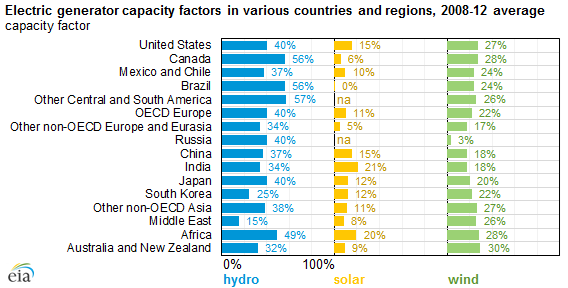
Renewable electricity generating plants depend on available renewable resources such as solar, wind, and water, which are largely determined by the availability of the natural resource. Because renewable technologies such as wind and solar are fast-growing in many regions and often starting from relatively small installed baselines, reported capacity factors are particularly affected by partial-year generation effects. Solar capacity factors are highest in India and parts of Africa, reflecting their high solar resource availability. Similarly, wind capacity factors are highest in Australia and New Zealand, while hydroelectric capacity factors are highest in Canada and South America.
Nuclear electric generating plants exhibit the least variability, and typically operate throughout the year as baseload generation sources in most countries, unless operational or regulatory requirements change their operation. Japan's 2011 earthquake contributed to a low five-year average capacity factor for nuclear generators in Japan because of the prolonged shutdown of its reactors starting in 2011.
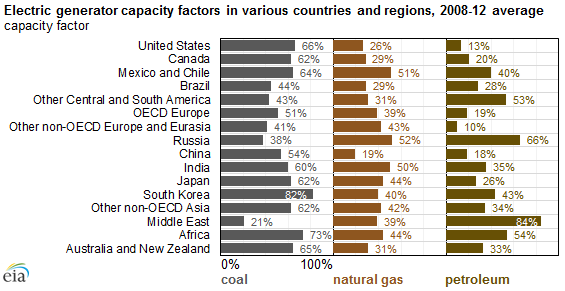
Fossil-fired generator capacity factors can exhibit great variability. Coal-fired generation has been the most economic form of fossil fuel generation in many regions, but growing environmental concerns associated with coal-fired generation and competition from natural gas-fired and renewable generation has recently lowered coal's capacity factor in some countries.
Note: Capacity factors reflect actual generation as a percent of continuous operation at full capacity. Capacity factors from the five-year period are weighted using their annual capacities and averaged. For regions with missing capacity factors for some years, only existing capacity factors are used to calculate a five-year weighted average.
Because natural gas and petroleum prices are typically higher than coal prices in most regions, plants using natural gas or petroleum are typically operated to meet loads during periods of peak and intermediate demand for electricity. Both Mexico and Russia demonstrated relatively high capacity factors for natural gas-fired generation, as both countries have high levels of natural gas production. Similarly, the Middle East maintained a high capacity factor (84%) for its petroleum-fired generating fleet because of relatively abundant domestic petroleum resources.
Principal contributor: Augustine Kwon