
EIA report highlights top 100 U.S. oil and natural gas fields
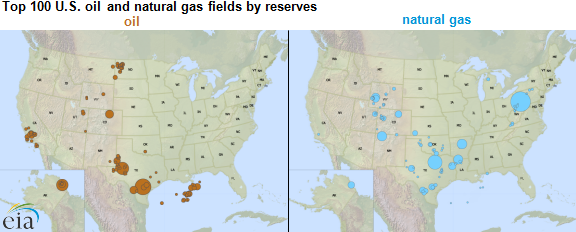
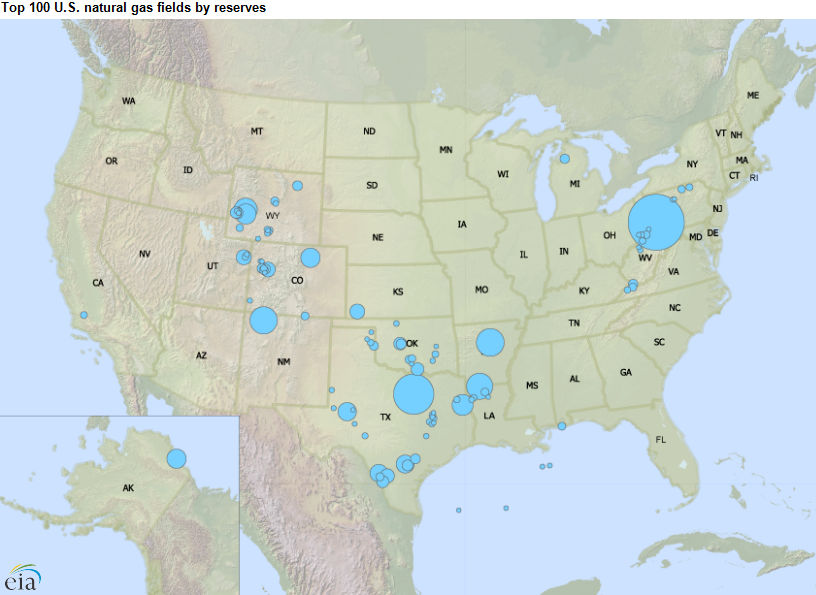
Note: The top 100 largest oil and natural gas field locations are plotted using latitude-longitude of the approximate center of the field. Dot diameter is relative to its 2013 proved reserves.
The top 100 oil fields in the United States accounted for 20.6 billion barrels of crude oil and lease condensate proved reserves, or 56% of the U.S. total in 2013. The top 100 natural gas fields accounted for 239.7 trillion cubic feet of natural gas proved reserves, 68% of the U.S. total. Proved reserves are defined as estimated quantities of oil and natural gas that analysis of geologic and engineering data demonstrates with reasonable certainty are recoverable under existing economic and operating conditions.
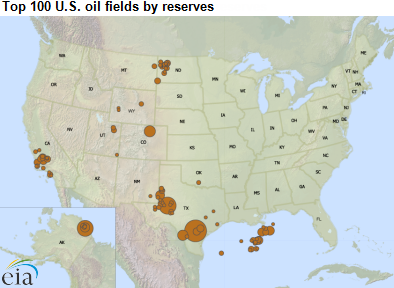
Note: The top 100 largest oil and natural gas field locations are plotted using latitude-longitude of the approximate center of the field. Dot diameter is relative to its 2013 proved reserves.
Note: Click to enlarge.
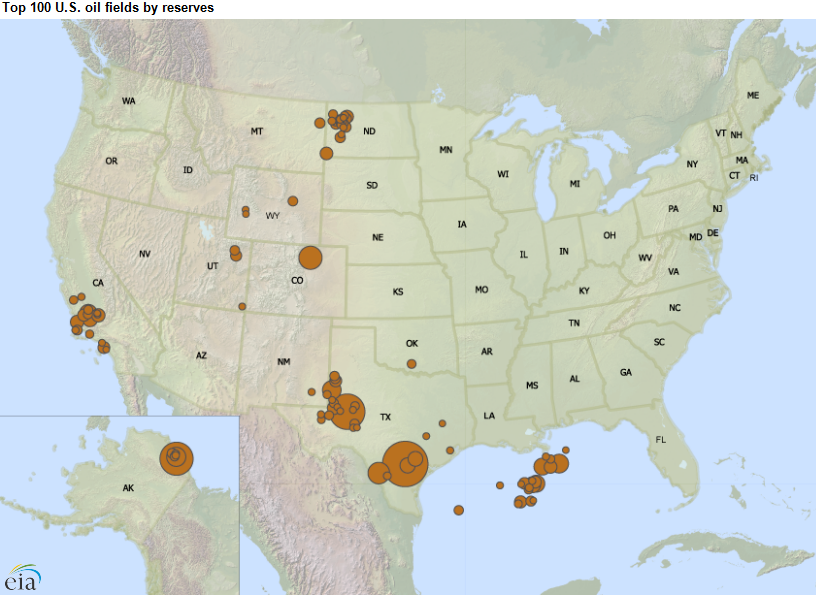
EIA last published the rankings of the top 100 oil and natural gas fields in 2009. Since then, using 2013 data, oil fields in the Eagle Ford and Bakken shale plays and natural gas fields in the Marcellus Shale have become significant contributors to total U.S. reserves. Fields in the Marcellus and Eagle Ford plays appear at the top of the list in their respective categories, whereas in 2009 the Marcellus fields were ranked in the bottom half of the list, and Eagle Ford fields (discovered in 2008) did not appear in the top 100. Alaska's Prudhoe Bay, previously the oil field with the largest amount of reserves, fell to third, behind fields in the Eagle Ford and Permian Basin.
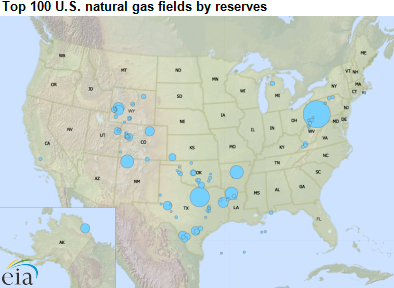
Note: The top 100 largest oil and natural gas field locations are plotted using latitude-longitude of the approximate center of the field. Dot diameter is relative to its 2013 proved reserves.
Note: Click to enlarge.
EIA defines a field as an area consisting of a single reservoir or multiple reservoirs grouped on, or related to, the same individual geological structural feature or stratigraphic condition. There may be two or more reservoirs in a field that are separated vertically or laterally by geologic features. However, this definition is not used by all states; consequently, areas classified as individual fields by some states may be combined in EIA's study.
According to EIA's report on U.S. oil and natural gas reserves, both crude oil and natural gas reserves increased in 2013. Oil reserves increased for the fifth consecutive year, reaching 36.5 billion barrels, and natural gas reserves offset their 2012 decline and reached a record high of 354 trillion cubic feet. Because prices affect the economics of production, price changes can have a significant effect on companies' proved reserves. The Securities and Exchange Commission (SEC) requires companies to assess proved reserves based on the average of the prices of a crude benchmark on the first day of each month for the year. Using, for example, front-month West Texas Intermediate (WTI) futures closing prices for the first trading day in each month of 2013, this value was $97.28 per barrel (bbl) for 2013. The comparable value for 2014, for which EIA is now collecting proved reserves data from operators, was slightly lower at $94.42/bbl.
However, prices that will be used for determining proved reserves for 2015 are forecast to be much lower. Nearly a third of the way through 2015, first-of-the-month average price for WTI for the first four months of the year is $50.49/bbl, a 47% decline from the 2014 price. This could result in reduced proved reserve additions and possibly some reduction in previously identified proved reserves for 2015 because some projects would become uneconomic.
More information can be found in EIA's report, Top 100 U.S. Oil and Gas Fields.
Principal contributor: Steven Grape
Tags: crude oil, liquid fuels, map, natural gas, oil/petroleum, reserves, states