EIA updates Eagle Ford maps to provide greater geologic detail
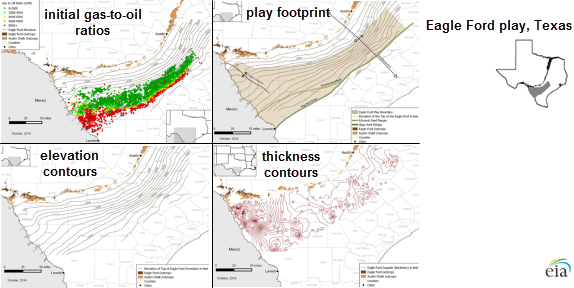
Recent updates to the Energy Information Administration's maps and geologic information for the Eagle Ford tight oil and shale gas play in Texas help to characterize the formation's structure, thickness, and surface area, as well as the gas-to-oil ratio of its producing wells from January 2000 to June 2014. This information provides a better understanding of recent production within the context of key geologic parameters. The updates can be seen in the following four tabs. The first tab provides additional information on the mix of oil and natural gas hydrocarbons produced by well location. Tabs 2 through 4 provide updated geological information.
Source: U.S. Energy Information Administration and Drillinginfo Inc., September 2014
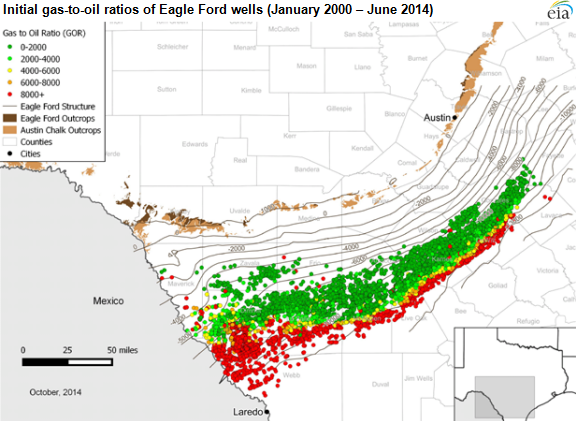
Note: EIA calculates the initial gas-to-oil ratio for each well using the second through fourth contiguous months of liquid and/or gas production. GORs are expressed as cubic feet per barrel (cf/bbl). The first month of production may not represent full production and thus is not included in the initial GOR calculation.
The mixture of oil and natural gas production by well is shown for a particular formation by mapping the initial gas-to-oil ratio (GOR), which is the ratio of natural gas to oil produced by a well over the second through fourth contiguous producing months. GORs are expressed as cubic feet per barrel (cf/bbl). High initial GORs (meaning gas-rich) wells of the Eagle Ford play are shown in orange and red along the southern edge of the play, and lower initial GOR (meaning oil-rich) wells are shown in green along the northern portion.
The distribution of initial GORs from Eagle Ford play wells generally corresponds to the depth of the hydrocarbons being accessed. In the eastern half of the play, deeper wells (up to 15,000 feet) to the south have higher initial GORs, or a relatively greater share of natural gas, while the shallower wells in the north have lower initial GORs, or a relatively greater share of oil. The western half of the play includes a wider depth distribution of wells, intersecting the formation from as deep as 14,000 feet to as shallow as 2,000 feet, and has initial GORs of 6,000 cf/bbl or higher (producing more gas relative to oil).
Source: U.S. Energy Information Administration, DrillingInfo, Inc., Texas Natural Resources Information, U.S. Geological Survey, University of Texas Bureau of Economic Geology
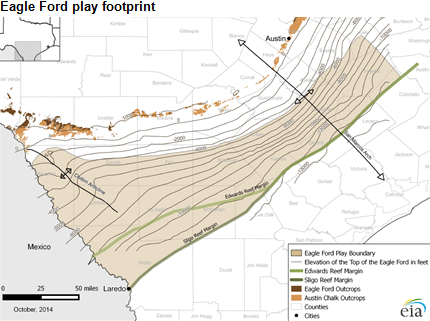
The Eagle Ford play has four major boundaries:
- The western border is the Rio Grande River, which forms the international border with Mexico. EIA does not have well-level production and geologic data from the Eagle Ford formation on the Mexican side of the border.
- The northern boundary is defined according to the thermal maturity—the temperature range at which oil is generated from the source rocks—of the hydrocarbons within the Eagle Ford Shale. The oil window ends and the immature area begins above a minimum subsea depth (i.e., depth below sea level) of 3,650 feet in Frio County and counties east, and above minimum depths in Maverick and Zavala counties, ranging from 650 to 2,900 feet.
- The southern boundary of the play traces the edge of the hydrocarbon-bearing part of the Eagle Ford Shale along the Sligo Reef Margin.
- The northeastern boundary roughly corresponds with where the carbonate-rich lower Eagle Ford (the primary target for drilling and completion) tapers off and transitions into silica-rich rock units of the Pepper Shale of the East Texas Basin, which, while hydrocarbon-bearing, is characterized as a different play than the Eagle Ford.
Source: U.S. Energy Information Administration, DrillingInfo, Inc., Texas Natural Resources Information, and U.S. Geological Survey
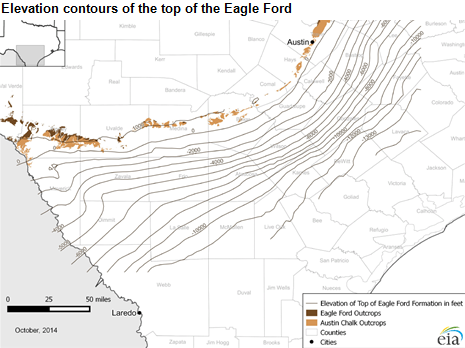
Contoured elevation maps of the top surface of a geologic formation (also called structure maps), constructed from point elevation data from wells and outcrops, provide the third dimension for characterizing depth or elevation of a play on an otherwise two-dimensional map. This depth essentially represents the minimum drilling depth to reach the top of the Eagle Ford formation. The elevation map for the top of the Eagle Ford formation was constructed from both subsurface well data and above-ground outcrop elevation data.
Source: U.S. Energy Information Administration, DrillingInfo, Inc., Texas Natural Resources Information
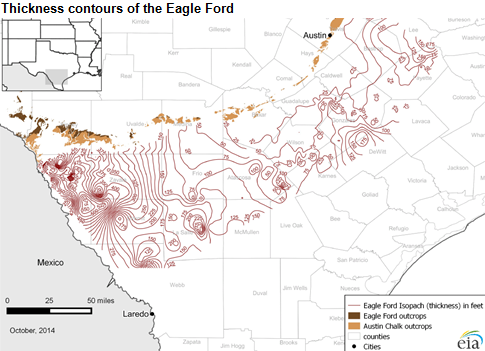
Formation thickness maps (isopachs) provide rough estimates of the thickness of plays. Thickness is one key input used to estimate resource volumes, such as oil- or gas-in-place estimates, in combination with other information such as porosity, pressure, and geologic history. The thickness contour maps for the Eagle Ford formation were constructed from subsurface point thickness data from individual well records that include both depth to the top and the base of the Eagle Ford formation.
Principal contributor: Meg Coleman
Tags: Eagle Ford, liquid fuels, map, natural gas, oil/petroleum, shale, states, Texas