Households with more vehicles travel more
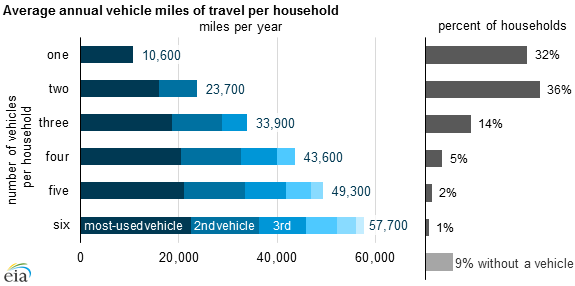
Based on data from the National Household Travel Survey, households with more vehicles not only travel more, but often put more miles on their most-used vehicle compared to households with fewer vehicles. Households with just one vehicle drove an average of 10,600 miles per year, while households with six or more vehicles traveled a total of 57,700 miles. Sixty-eight percent of households have either one or two cars.
Households with more vehicles also tend to drive their primary (most-used) vehicle more than households with fewer vehicles. While a two-vehicle household travels almost 16,000 miles annually with the most-used vehicle, a six- (or more) vehicle household travels more than 22,000 miles annually with the most-used vehicle. The average use per vehicle within a household is greatest in a two-vehicle home, where the average vehicle travels about 11,800 miles. This average declines as the households gain more vehicles so that a six-vehicle home averages about 9,600 miles per vehicle.
Household expenditures on gasoline depend on the price of the fuel as well as the amount of fuel consumed per vehicle. Gasoline consumption, in turn, is dependent on both driving behavior (measured by vehicle miles traveled, or VMT) and vehicle fuel economy (measured in miles per gallon). Changes in gasoline prices are typically the primary factor in short-term fluctuations in gasoline expenditures, while changes in VMT and fuel economy often reflect longer-term trends.
The National Household Travel Survey (NHTS) is conducted by the U.S. Department of Transportation's Federal Highway Administration and is only published every five to eight years. The latest data year for this survey was 2009, a year with relatively low gasoline prices, which tends to increase vehicle travel, but also a year of relatively high unemployment, which tends to decrease vehicle travel. Collection of 2015 data is expected to begin later this year.
As discussed in previous articles, the Consumer Expenditure Survey (CES) reports that 13% of consumer units neither own nor lease a vehicle, while the NHTS reports 9% of households are without a vehicle. These dissimilar percentages highlight differences in the surveys. Although the terms consumer units and households are often used interchangeably, the terms have different meanings. There are more consumer units than households: the 2009 CES reported 121 million consumer units, while the 2009 NHTS reported 113 million households. People sharing a household but who are financially independent (such as three graduate students living together) would be considered one household by the NHTS but three consumer units by the CES.
Principal contributor: Trisha Hutchins
Tags: residential, transportation