U.S. household gasoline expenditures expected to fall in 2015
Note: Gasoline expenditures include spending on motor oil.
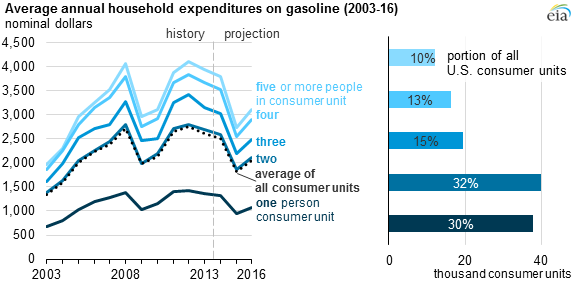
The average U.S. household expenditure on motor gasoline in 2015 is expected to be about $1,817, the lowest level in more than a decade. This level is about $700 less than average household gasoline expenditures in 2014. Actual spending can vary based on driving-related factors (number of vehicles, annual distance driven), some of which depend on demographic considerations (location, income, size of household). As one might expect, households with more people tend to spend more on gasoline in a year.
Through its Consumer Expenditure Survey (CES), the Bureau of Labor Statistics (BLS) surveys spending of American consumer units, a term essentially equivalent to a household (i.e., people who live together and make joint expenditure decisions). Two-person households represent the highest portion of all households (about one-third in 2013) and have motor gasoline expenditures close to the average of all households. Historical data from this survey show that households with five or more people spend about 40%-50% more annually on gasoline compared with two-person households, while one-person households spend about 50% less.
The averages reported in the CES include all consumption units, regardless of whether they own or lease a vehicle. Since the CES reports that 13% of households neither own nor lease a vehicle, average gasoline expenditure savings are somewhat higher when only households with vehicles are considered.
Using projected gasoline prices in EIA's Short-Term Energy Outlook, annual expenditures for gasoline are expected to fall from $2,513 in 2014 to $1,817 in 2015 and then rise 13% to $2,058 in 2016. This calculation reflects the expected change in gasoline prices but does not take into account more gradual changes in average fuel economy and driving behavior.
Changes in U.S. gasoline prices tend to follow changes in crude oil prices, particularly the international benchmark North Sea Brent price. The 2015 average Brent price is expected to be $40 per barrel ($0.94 per gallon) lower than the 2014 average. Similarly, the annual average retail price for regular gasoline in the United States is expected to be $0.96 per gallon lower in 2015. After a long period of declining prices, the price for U.S. regular gasoline has increased from a monthly average $2.12 per gallon in January to $2.46 per gallon in March. This year, the price of regular gasoline is expected to average $2.40 per gallon compared with an average of $3.36 per gallon last year.
In recent decades, both fuel economy and driving behavior (measured as annual vehicle miles traveled, VMT) have worked to reduce consumer expenditures on gasoline. Light-duty vehicles have become more efficient, partly as a result of federal standards (Corporate Average Fuel Economy standards, or CAFE). VMT has also been declining based on the influence of several economic, demographic, and technological factors.
Between 2003 and 2008, average annual household expenditures on gasoline rose steadily by about 15% per year, to $2,715 in 2008. The economic recession in 2009 resulted in a 27% drop in gasoline expenditures, with both lower prices and reduced consumption. Since then, gasoline expenditures rose through 2012 and fell in both 2013 and 2014.
Subsequent articles will examine how these expenditures vary by region and income levels, how they compare with other transportation expenditures on public transit, and how driving behavior can also vary by household.
Principal contributors: Tancred Lidderdale, Trisha Hutchins