Notice: EIA has suspended data collection for two surveys supporting the
Petroleum Marketing Monthly. We will continue to update the PMM crude oil prices section (data tables 1, 1A, 18 – 27). See our latest
press release for more details.
Monthly price and volume statistics on crude oil and petroleum products at a national, regional
and state level.
| Highlights
|
|
Petroleum marketing monthly highlights |
PDF |
|
| Summary statistics tables |
PDF |
| 1 |
Crude oil prices |
PDF |
|
| 1A |
Refiner acquisition cost of crude oil by PAD Districts |
PDF |
|
| 2 |
U.S. refiner prices of petroleum products to end users |
PDF |
|
| 3 |
U.S. refiner volumes of petroleum products to end
users |
PDF |
|
| |
Motor gasoline to end users |
|
|
| |
Residual fuel oil and No. 4 fuel to end users |
|
|
| |
Other petroleum products to end users |
|
|
| 4 |
U.S. refiner prices of petroleum products for resale |
PDF |
|
| 5 |
U.S. refiner volumes of petroleum products for resale |
PDF |
|
| |
Motor gasoline for resale |
|
|
| |
Residual fuel oil and No.4 fuel for resale |
|
|
| |
Other petroleum products for resale |
|
|
| 6 |
U.S. refiner motor gasoline prices by grade and sales type |
PDF |
|
| 7 |
U.S. refiner motor gasoline volumes by grade and sales type |
PDF |
|
| 8 |
U.S. refiner conventional motor gasoline prices by grade and sales type |
PDF |
|
| 9 |
U.S. refiner conventional motor gasoline volumes by grade and sales type |
PDF |
|
| 10 |
U.S. refiner reformulated motor gasoline prices by grade and sales type |
PDF |
|
| 11 |
U.S. refiner reformulated motor gasoline volumes by grade and sales type |
PDF |
|
| 12 |
U.S. propane (consumer grade) prices by sales type |
PDF |
|
| 13 |
U.S. No. 2 distillate prices by sales type |
PDF |
|
| 14 |
U.S. No. 2 diesel fuel prices by sulfur content and sales type |
PDF |
|
| 15 |
Prices of No. 2 distillate to residences by PAD District and selected states |
PDF |
|
| 16 |
U.S. refiner residual fuel prices |
PDF |
|
| 17 |
U.S. refiner residual fuel volumes |
PDF |
|
| Summary
statistics figures
|
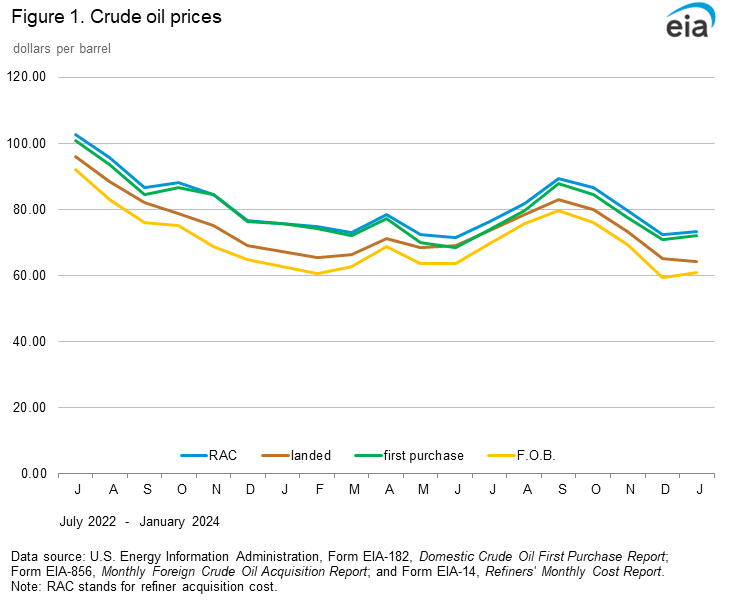
| 1 |
Crude oil prices |
PDF |
|
| 2 |
U.S. refiner retail petroleum product prices |
PDF |
|
| 3 |
U.S. refiner retail petroleum product volumes |
PDF |
|
| 4 |
U.S. refiner wholesale petroleum product prices |
PDF |
|
| 5 |
U.S. refiner wholesale petroleum product volumes |
PDF |
|
| 6 |
U.S. No.2 distillate prices to residences by PAD
District |
PDF |
|
| 7 |
U.S. refiner residual fuel oil prices |
PDF |
|
| Crude
oil prices tables |
PDF |
| 18 |
Domestic crude oil first purchase prices |
PDF |
|
| 19 |
Domestic crude oil first purchase prices for selected crude streams |
PDF |
|
| 20 |
Domestic crude oil first purchase prices by API gravity |
PDF |
|
| 21 |
F.O.B. costs of imported crude oil by selected country |
PDF |
|
| 22 |
Landed costs of imported crude oil by selected country |
PDF |
|
| 23 |
F.O.B. costs of imported crude oil by API gravity |
PDF |
|
| 24 |
Landed costs of imported crude oil by API gravity |
PDF |
|
| 25 |
Percentages of total imported crude oil by API gravity |
PDF |
|
| 26 |
F.O.B. costs of imported crude oil for selected crude streams |
PDF |
|
| 27 |
Landed costs of imported crude oil for selected crude streams |
PDF |
|
| Prices
of petroleum products tables |
PDF |
| 28 |
Motor gasoline prices by grade, sales type, PAD District, and state |
PDF |
|
| 29 |
Conventional motor gasoline prices by grade, sales type, PAD District, and state |
PDF |
|
| 30 |
Reformulated motor gasoline prices by grade, sales type, PAD District, and state |
PDF |
|
| 31 |
Refiner motor gasoline prices by grade, sales type, PAD District, and state |
PDF |
|
| 32 |
Refiner prices of aviation fuels and kerosene by PAD District and state |
PDF |
|
| 33 |
Refiner prices of distillate fuels by PAD District and state |
PDF |
|
| 34 |
Propane (consumer grade) prices by sales type and PAD District |
PDF |
|
| 35 |
No. 2 distillate prices by sales type, PAD District, and selected states |
PDF |
|
| 36 |
No. 2 diesel fuel prices by sales type, PAD District, and state |
PDF |
|
| 37 |
No. 2 diesel fuel prices by sulfur content, Sales type, and PAD District |
PDF |
|
| 38 |
Residual fuel oil prices by PAD District and selected states |
PDF |
|
| Volumes
of petroleum products tables |
PDF |
| 39 |
Refiner motor gasoline volumes by grade, sales type, PAD District, and state |
PDF |
|
| 40 |
Refiner motor gasoline volumes by formulation, sales type, PAD District, and state |
PDF |
|
| 41 |
Refiner volumes of aviation fuels, kerosene, No. 1 distillate, and propane by PAD District and state |
PDF |
|
| 42 |
Refiner No. 2 diesel fuel volumes by PAD District and state |
PDF |
|
| 43 |
Refiner No. 2 distillate and fuel oil volumes by PAD District and state |
PDF |
|
| 44 |
Refiner residual fuel oil and No. 4 fuel volumes by PAD District |
PDF |
|
| Prime
supplier sales volumes of petroleum products for local consumption
tables |
PDF |
| 45 |
Prime supplier sales volumes of motor gasoline by grade, formulation, PAD District, and state |
PDF |
|
| 46 |
Prime supplier sales volumes of aviation fuels, No. 4 fuel oil, propane, and residual fuel oil by PAD District and state |
PDF |
|
| 47 |
Prime supplier sales volumes of distillate fuel oils and kerosene by PAD District and state |
PDF |
|