Oil price decline leads to lower tax revenues in top oil-producing states
The decline in spot oil prices in the last half of 2014 and first month of 2015 has reduced oil and natural gas production tax revenues in some of the largest oil- and natural gas-producing states.
Texas, North Dakota, Alaska, and Oklahoma are four of the five top oil- and natural gas-producing states, and they derive a significant share of their unrestricted operating revenues from taxes on oil and natural gas production. Although California produces more oil than both Alaska and Oklahoma, its economy is much larger, making it relatively less affected by changes in oil and natural gas prices and production.
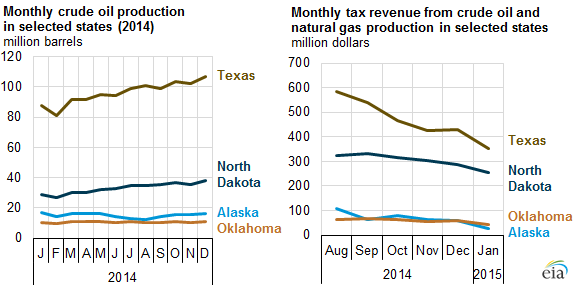
- Texas collected $583 million in tax receipts from oil and natural gas production in August 2014, but tax revenue declined by 40% to $352 million in January 2015, based on data from the state's comptroller. EIA estimates crude oil and lease condensate production in Texas also increased through December, growing from 88 million barrels to 107 million barrels from January to December 2014.
- North Dakota' s tax revenue from oil and natural gas production decreased from $323 million in August 2014 to $254 million in January 2015, a 21% reduction. Monthly production has continued to increase through December even as prices declined, according to the latest production data.
- Alaska relies on revenue from crude oil production for 90% of its operating budget. The state's 2015 revenue projections assumed oil prices at $105 per barrel. According to initial oil and natural gas production tax receipts received by the Alaska Tax Accounting System, monthly oil and gas production tax revenue in August 2014 was $108 million. In January 2015, revenue from these taxes was $26 million. The oil and natural gas production tax represents one of the four primary components of petroleum revenue for the state, with the others being corporate income taxes, property taxes, and royalties collected by the Alaska Permanent Fund Corporation.
- Oklahoma collected $62 million in funds from production oil and natural gas taxes in August 2014. This value declined to $43 million in January 2015, a drop of roughly 30%, based on information from the Oklahoma Tax Commission. Oklahoma's production was relatively flat during this period.
The production estimates and tax data referenced in this story are preliminary and are subject to change.
Principal contributors: John Krohn, Robert McManmon
Tags: Alaska, natural gas, North Dakota, oil/petroleum, Oklahoma, prices, states, taxes, Texas