
Crude oil and lease condensate production at highest volume since 1986
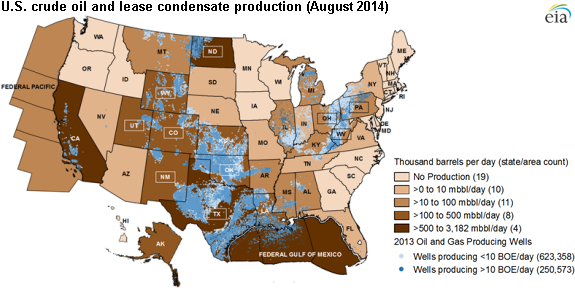
Note: Click to enlarge.
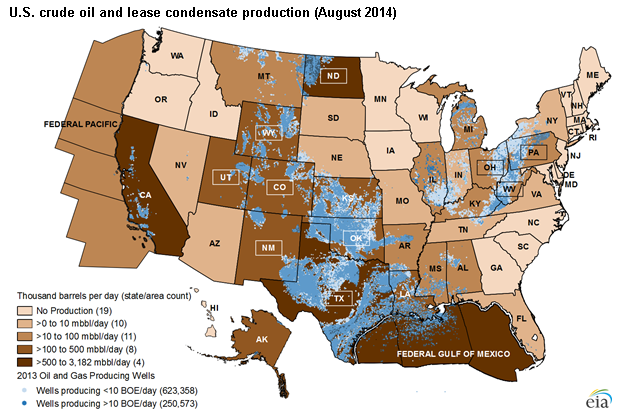
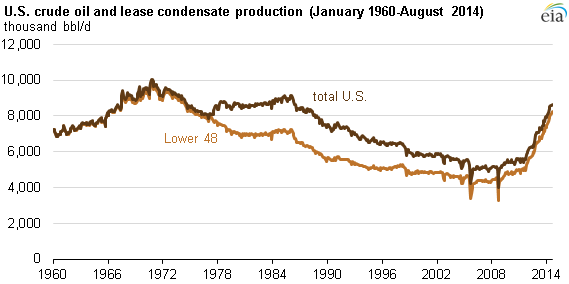
Crude oil and lease condensate production in the United States exceeded 8.6 million barrels per day (bbl/d) in August, a production volume not observed since July 1986, according to EIA's latest Petroleum Supply Monthly.
More than half of total U.S. production was accounted for by record production from three basins in three states. Production from the Permian Basin in Texas and New Mexico accounted for 1.66 million bbl/d, while the Eagle Ford Shale in the Western Gulf Basin, also located in Texas, produced 1.57 million bbl/d. The Bakken Shale in North Dakota's Williston Basin accounted for 1.13 million bbl/d.
Domestic production has increased dramatically over the past four years, increasing from 5.4 million bbl/d in January 2010 to its current level, driven by increasing production from shale and other tight formations. During 2014 alone, 10 states (the three states previously mentioned in addition to Oklahoma, Colorado, Wyoming, Utah, Ohio, West Virginia, and Pennsylvania) have set monthly production records since 1995, and accounted for more than 64% of total U.S. production during August.
Although down from 2,031 rigs in 2008, U.S. oil and natural gas rig counts have been increasing over the past two years. A total of 1,904 rigs were actively drilling during August, 1,578 of which were targeting liquids. Notably, once production starts, three-fifths of all the wells produce both oil and natural gas. Of the 1,904 active rigs, 62 rigs were operating offshore while the remaining 1,842 rigs were drilling onshore.
Now typical of the industry, horizontal rigs represent the most common rig type with 1,330 active drilling operations in August, while 374 vertical and 210 directional drilling rigs were operational, respectively. Higher rig counts, along with improvements in drilling productivity, are expected to increase U.S. liquids production to nearly 9.7 million bbl/d by December 2015.
U.S. oil production has been increasing monthly at an average of 62,000 bbl/d since 2010. EIA forecasts that previous production highs set in the 1970s will be surpassed before the end of 2015. This is especially notable as Alaska production provided up to 2 million bbl/d of total U.S. production volumes during high production years in the 1980s. Decreases in Alaska production are related to natural reservoir decline and reduced exploration along the North Slope; however, discoveries in southern portions of Alaska's Cook Inlet are adding new production capacity.
Production gains have been observed across the Lower 48, with particular increases in crude oil and lease condensate production from shale and tight formations. Production estimates from EIA's Drilling Productivity Report confirm that many top-producing reservoirs include production involving horizontally drilled wells, hydraulic fracturing reservoir stimulation, and multi-well pad drilling. The highest-ranked tight producing reservoirs in 2014 include Texas's Eagle Ford and Wolfcamp formations, North Dakota's Bakken-Three Forks formations, New Mexico's top Spraberry and Bone Springs formations, Oklahoma's Woodford Shale formations, Colorado's Niobrara formation, Utah's Green River formations, Ohio's Utica and Point Pleasant formations, and the Marcellus Shale formations in West Virginia and Pennsylvania.
Principal contributor: Evan Frye
Tags: Bakken, crude oil, Eagle Ford, liquid fuels, map, production/supply