
Florida gasoline supply sources and prices reflect broader market shifts
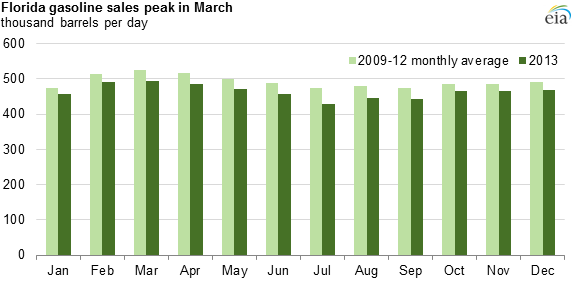
Gasoline consumption in Florida typically peaks in March, when the seasonal population is high and spring tourism is high. However, changes in Florida's gasoline market and the way the state is supplied have resulted in tighter markets and changing price relationships.
After the March peak, and through the rest of the spring and into the summer, Florida gasoline consumption typically declines as tourism slows and seasonal residents head north to escape the heat. This consumption pattern differs from that of other states, where gasoline consumption typically peaks in July and August and is lowest during the winter months.
Historically, Florida's gasoline was supplied from the U.S. Gulf Coast (USGC) and augmented with imports, particularly from Caribbean refineries. However, since 2007, Florida gasoline consumption (as measured by prime supplier sales) has fallen 90,000 barrels per day (bbl/d) to an average of 465,000 bbl/d in 2013. Imports have also fallen as a result of lower consumption and the 2012 idling of two refineries in Aruba and on Saint Croix, in the U.S. Virgin Islands, which used to supply Florida with substantial amounts of gasoline. As a result, USGC refineries have increased their share of Florida's gasoline supply.
The way in which the USGC supplies Florida has resulted in a tighter market in the state, despite consumption declines. Because Florida is not connected to the USGC by pipeline, almost all gasoline supplied to Florida is from waterborne cargoes. The ships and barges arrive at ports including Tampa, Port Everglades, Port Canaveral, and Jacksonville. From the storage terminals at these ports, gasoline and other petroleum products are distributed to local markets via tanker truck.
The only product supplied to Florida through a pipeline is sourced from a terminal in Bainbridge, Georgia, that is connected to a spur of the Colonial Pipeline system. The terminal in Bainbridge supplies product to Florida's panhandle by tanker truck. The Central Florida Pipeline System, which runs from Tampa to Orlando, carries petroleum products that arrive at ports in the Tampa Bay area to inland markets within Florida. A short pipeline runs from Port Everglades to Miami and Fort Lauderdale airports, but it carries no gasoline.
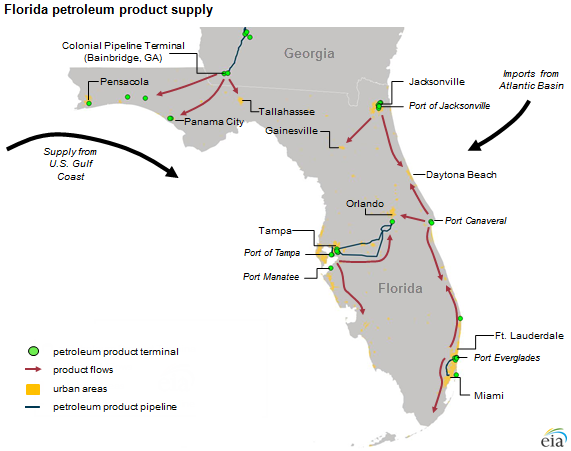
The gasoline shipped to Florida from the USGC arrives via a limited fleet of coastwise-compliant (Jones Act) U.S.-flagged tankers, articulated tug-barges, and smaller barges that travel along the Intracoastal Waterway and the open waters of the Gulf of Mexico. However, this fleet is relatively small, and increasing demand for vessels to move U.S.-produced crude oil along the Texas and Louisiana coasts has diverted many vessels that had been moving products to Florida.
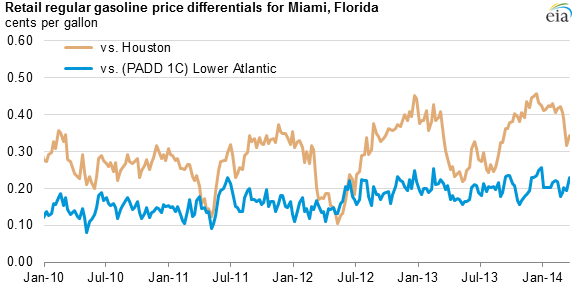
As a result of reduced vessel availability, gasoline supplies in Florida have been tight, and gasoline prices have increased compared with other locations. Retail prices for regular gasoline in Miami, Florida, have steadily increased compared with prices in Houston, Texas, and with the rest of the Lower Atlantic region. In 2010, Miami retail prices averaged 27 cents per gallon higher than those in Houston. Since December 2012, Miami prices have at times exceeded prices in Houston by more than 40 cents per gallon, and they were consistently above that level for most of the past winter.
Principal contributor: T. Mason Hamilton