Released: January 19, 2012
Next Release: January 25, 2012
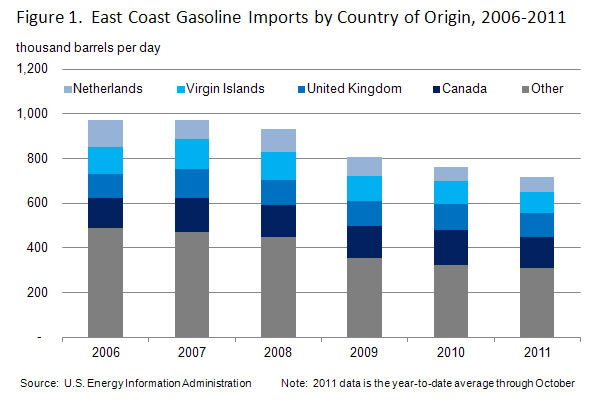
East Coast Gasoline Imports: Recent Trends and Developments
The recent idling of two refineries in southeastern Pennsylvania and previously announced plans to idle an additional refinery in the region by mid-2012 would, taken together, reduce operating refinery capacity along the entire East Coast by 52 percent. This reduction in refinery activity, if fully implemented and made permanent, looks set to reverse recent declines in U.S. gasoline imports even if end-user demand for gasoline continues to edge lower, as expected by the U.S. Energy Information Administration (EIA). On its face, any short-term increase in aggregate East Coast import requirements that may result from the closures would not cause East Coast gasoline imports to exceed peak levels recorded in 2006. The need for alternate supply, however, may be felt most acutely in the region surrounding the idled plants, which is currently ill-equipped to handle larger product import volumes. Price increases relative to other markets could be required to overcome short-term logistical hurdles.
On the back of strong demand for products in Latin America and other emerging markets and sagging demand at home, U.S. exports of refined products surged to record levels in 2011, while imports fell to levels not seen since early last decade. As a result, U.S. exports of petroleum products exceeded imports in 2011 for the first time since at least 1949. The East Coast was no exception; total product imports into the region were lower (through October) than any annual average since 1999.
The sustainability of this trend is not assured, however, particularly on the East Coast. With the idling of ConocoPhillips' Trainer refinery and Sunoco's Marcus Hook refinery, East Coast refining capacity dropped by 27 percent since the end of September. Sunoco has said that, in the absence of a buyer, it would also shut its Philadelphia refinery by mid-2012. Increased imports would likely comprise a major portion of replacement product supplies, particularly for gasoline.
The East Coast is by far the largest gasoline market in the United States. Gasoline accounts for most product imports into the region. In 2010, the East Coast imported 760,000 barrels per day (bbl/d) of gasoline, or 24 percent of all gasoline consumed regionally, but only 198,000 bbl/d of distillate fuel (17 percent of consumption) and 46,000 bbl/d of jet fuel (8 percent of consumption). However, products shipped by pipeline from the U.S. Gulf Coast provide the largest share of products consumed along the East Coast.
Historically, the East Coast has attracted gasoline imports from several major sources in the Atlantic Basin. Canada, the United Kingdom, and the U.S. Virgin Islands together accounted for almost half of the region's gasoline imports in 2010. Several major export-oriented refineries in these locations have been critical in supplying the United States, including Irving Oil's refinery in St. John, New Brunswick and HOVENSA's refinery on St. Croix, U.S. Virgin Islands. However, HOVENSA announced on January 18 that they plan to shut down the St. Croix refinery in mid-February and convert it to a petroleum storage facility. Continental Europe also supplies the East Coast, with the Netherlands, Spain, and France, among others, regularly shipping gasoline across the Atlantic.
The potential shuttering of the three Philadelphia-area refineries mentioned above could result in the loss of about 300,000 bbl/d in local gasoline production. There are limited alternative sources for these supplies. Supply options include increasing ethanol use, increasing production at local refineries, increasing shipments from other regions of the United States, and increasing imports. The first three of these options appear likely to provide only marginal help in the near term. On the ethanol front, the East Coast is already blending ethanol at close to 10 percent, the near-term market saturation point, and despite the U.S. Environmental Protection Agency having approved blends of up to 15 percent ethanol, increasing blending above 10% still faces some regulatory and market hurdles. There might be some ability to increase production from other East Coast refineries, but that too would only go so far.
Increasing supplies from other regions in the United States, particularly the Gulf Coast, is another option. However, pipeline capacity from the Gulf Coast to the Northeast is constrained. While plans are underway to alleviate some constraints, they will take time to implement, and even then there will still not be enough capacity to fully make up for reduced production from the three refineries. Moreover, given the EIA's current projections, demand declines cannot be counted on to alleviate supply tightness to the extent they have over the past several years. Assuming that East Coast consumption continues to decline at the same rate as the forecasted national average (it fell at the same rate as the national average year-to-date through October in 2011), it will fall by only about 10,000 bbl/d over the next two years.
With other domestic sources largely off the table, imports are likely to play the largest role in bridging potential supply gaps. As local production diminishes, an increase in spot prices in New York Harbor, the East Coast's product hub, relative to other locations would be likely to incentivize additional gasoline shipments to the region. Some of this is likely to come from the East Coast's historical suppliers. But while Europe continues to produce more gasoline than it consumes, refining sector rationalization currently taking place on the Continent leaves some questions regarding Europe's long-term ability to increase gasoline shipments. Moreover, the closure of HOVENSA's St. Croix refinery eliminates a major historical supplier of gasoline to the East Coast. By eliminating a major source of imports from the Americas, this closure is likely to further lengthen the East Coast gasoline supply chain as product will have to come from farther afield. One likely source for significant volumes of incremental supply is India. With significant refinery capacity additions over the past few years, it looms increasingly large in global product markets and is already exporting about 40,000 bbl/d of gasoline to the U.S. East Coast. Additional volumes could come from refining capacity increases elsewhere in Asia, notably China.
From an offloading standpoint, current port infrastructure looks sufficient in aggregate, as East Coast gasoline imports through October were running about 260,000 bbl/d below their 2006 record level of 975,000 bbl/d. Some of the major ports seem to have more than enough room to bring in additional supplies. Newark, NJ, the largest East Coast port for gasoline, is currently bringing in roughly 75,000 bbl/d less gasoline than during its peak year. The second and third largest East Coast ports, Boston, MA and Perth Amboy, NJ, also are bringing in less than during recent years.
Greater Philadelphia is another matter, however, as are some of the other areas previously supplied by the three refineries targeted for closure, particularly western Pennsylvania and western New York. More supply may be needed in those areas than in the areas served by New York Harbor. In contrast with New York, the Philadelphia ports are better equipped to bring crude oil into the refineries than products to market. Importing products into these areas may be a challenge and could create the need for short-term market reconfigurations, such as longer distance trucking occurring higher in the supply chain.
The East Coast's increased reliance on imports would also occur against the backdrop of strong demand growth in emerging economies, notably South America. U.S. exports of gasoline have increased significantly over the past few years as U.S. refineries have taken advantage of those growing markets. Any demand pull from the East Coast will serve to tighten markets, which could more broadly support gasoline margins.
Gasoline price increases for a fourth straight week
The U.S. average retail price of regular gasoline reached $3.39 per gallon after rising less than a penny this week. The average price increased over $0.16 per gallon in the last four weeks and was $0.29 per gallon higher than last year at this time. The largest regional increase occurred on the East Coast, a rise of almost two cents to $3.43 per gallon. The Gulf Coast region followed with an increase of a cent to land at $3.21 per gallon. The Midwest moved about a penny higher while the West Coast price was virtually unchanged after increasing just two-tenths of a cent. The West Coast average remained the highest in the Nation at $3.61 per gallon. The Rocky Mountain average decreased for the thirteenth consecutive week, dropping almost a penny to $3.00 per gallon.
The national average diesel price rose for the second consecutive week, increasing over two cents to $3.85 per gallon. The diesel price is $0.45 per gallon higher than last year at this time. The East Coast had the largest regional increase at three and a half cents per gallon to put the price at $3.94 per gallon. The Gulf Coast and Midwest regions both increased just under three cents per gallon to $3.78 per gallon and $3.75 per gallon, respectively. The West Coast average increased just over a penny to the highest regional price of $4.04 per gallon. The Rocky Mountain price went against the trend and decreased two cents to $3.82 per gallon.
U.S. average heating oil price increases
The residential heating oil price increased during the week ending January 16, 2012. The average residential heating oil price rose by $0.02 per gallon this week to reach $3.95 per gallon. This price is $0.50 per gallon higher than the same time last year. The wholesale heating oil price decreased by $0.04 per gallon this week to $3.12 per gallon, $0.38 per gallon higher than last year at this time.
The average residential propane price increased by less than $0.01 per gallon, nearly reaching $2.87 per gallon, which is $0.08 per gallon higher than last year. The average wholesale propane price decreased by $0.05 per gallon to nearly $1.21 per gallon. This was a decrease of $0.25 per gallon when compared with the January 17, 2011 price of $1.45 per gallon.
Propane inventories continue seasonal descent
Total U.S. propane stocks continued to drop last week, falling by 1.1 million barrels to end at 53.2 million barrels, which is at the upper end of the five-year range. The East Coast region led the draw, with stocks dropping by 0.4 million barrels. The Midwest and Gulf Coast regional inventories each fell by 0.3 million barrels and the Rocky Mountain/West Coast stocks declined slightly. Propylene non-fuel use inventories represented 10.0 percent of total propane inventories.
Text from the previous editions of This Week In Petroleum is accessible through a link at the top right-hand corner of this page.