U.S. Energy Information Administration logo
Skip to sub-navigation
January 13, 2014

U.S. energy-related CO2 emissions in 2013 expected to be 2% higher than in 2012
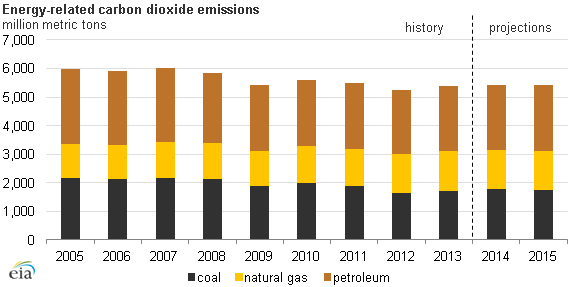
graph of energy-related carbon dioxide emissions, as explained in the article text
Source: U.S. Energy Information Administration, Short-Term Energy Outlook, January 2014

Once all data are in, energy-related carbon dioxide (CO2) emissions in 2013 are expected to be roughly 2% above the 2012 level, largely because of a small increase in coal consumption in the electric power sector. Coal has regained some market share from natural gas since a low in April 2012; however the impact on overall emissions trends remains fairly small.

Emissions in 2013 are slightly more than 10% below 2005 levels, a significant contribution towards the goal of a 17% reduction in emissions from the 2005 level by 2020 that was adopted by the current Administration. This level of reduction is expected to continue through 2015, according to EIA's most recent Short-Term Energy Outlook.
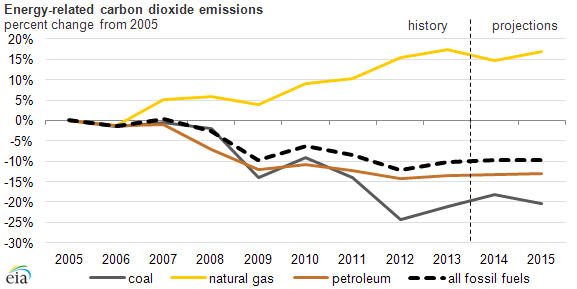
graph of energy-related carbon dioxide emission, as explained in the article text
Source: U.S. Energy Information Administration, Short-Term Energy Outlook, January 2014

CO2 emissions from energy activities declined four out of six years since their 2007 peak, and were historically low (12% below the 2005 level) in 2012. From 2005 to 2013, the key energy-economic drivers of a changing U.S. energy landscape included:

  • Weak economic growth in recent years, dampening growth in energy demand compared to pre-recession expectations
  • Continuously improving energy efficiency across the economy, including buildings and transportation
  • High energy prices over the past four years, with the exception of natural gas, since about 2010
  • An abundant and inexpensive supply of natural gas, resulting from the widespread use of new production technologies for shale gas
  • Power sector decarbonization since 2010, as natural gas and renewables displaced coal

Principal contributors: Yanna Antypas, Tyson Brown

Statistics
Analysis
Tools
Education
News

Petroleum & Other Liquids

Crude oil, gasoline, heating oil, diesel, propane, and other liquids including biofuels and natural gas liquids.

Natural Gas

Exploration and reserves, storage, imports and exports, production, prices, sales.

Electricity

Sales, revenue and prices, power plants, fuel use, stocks, generation, trade, demand & emissions.

Coal

Reserves, production, prices, employment and productivity, distribution, stocks, imports and exports.

Nuclear & Uranium

Uranium fuel, nuclear reactors, generation, spent fuel.

Renewable & Alternative Fuels

Includes hydropower, solar, wind, geothermal, biomass and ethanol.

EIA Survey Forms

Forms EIA uses to collect energy data including descriptions, links to survey instructions, and additional information.

Total Energy

Comprehensive data summaries, comparisons, analysis, and projections integrated across all energy sources.

U.S. States

State energy information, including overviews, rankings, data, and analyses.

International

International energy information, including overviews, rankings, data, and analyses.

Environment

Greenhouse gas data, voluntary reporting, electric power plant emissions.

Data Tools, Apps, & Maps

Tools to customize searches, view specific data sets, study detailed documentation, and access time-series data.

Open Data

EIA's free and open data available as API, Excel add-in, bulk files, and widgets

EIA Beta

Come test out some of the products still in development and let us know what you think!

Open Source Code

EIA's open source code, available on GitHub.

RSS Feeds

Subscribe to feeds for updates on EIA products including Today in Energy and What's New.