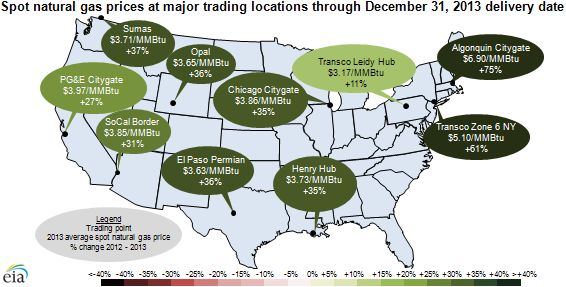
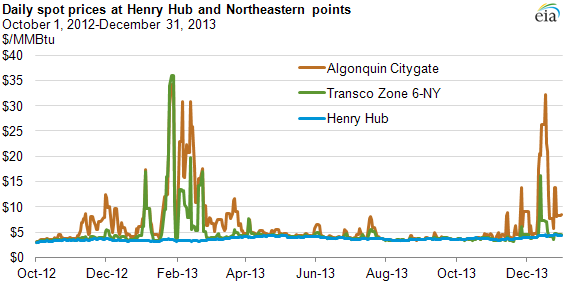
New England and New York have largest natural gas price increases in 2013
Note: Spot prices are averaged by delivery date.
Republished January 7, 2014, text was modified to clarify content.
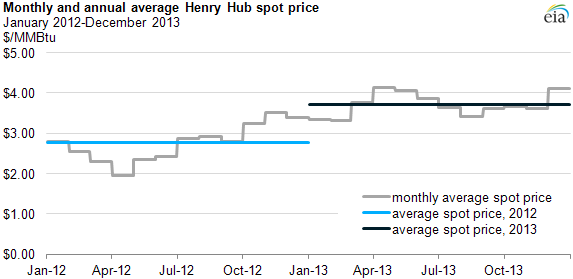
Average wholesale (spot) prices for natural gas increased significantly throughout the United States in 2013 compared to 2012. The average wholesale price for natural gas at Henry Hub in Erath, Louisiana, the key benchmark location for pricing throughout the United States, rose 35% to $3.73 per million British thermal units (MMBtu) in 2013. Increased winter demand pushed inventories down and prices up to above $4.00/MMBtu in March and April, but decreased consumption for electric generation over the summer and positive (but flattening) production growth kept 2013 prices at their lowest level since 2002 with the exception of 2012.
The price increases were relatively uniform, except in the northeastern United States, where cold-weather-driven demand spikes exacerbated the impact of pipeline constraints in Boston and New York City markets. The importance of supply changes for prices is shown at the Transco Leidy Hub in Pennsylvania where prices in 2013 were only 11% higher than in 2012, despite much greater absolute and percentage price increases at nearby hubs serving New York City and Boston. The Leidy Hub prices were most directly affected by continued growth in production from the Marcellus shale.
Note: Spot prices are averaged by delivery date.
Natural gas price movements often fall into season patterns, which held true in 2013, but also fall into regional patterns and affected production volumes as well as the futures market. Key trends along these lines are discussed below:
January-April. Spot prices rose at the beginning of 2013 and exceeded $4.00/MMBtu in March, a level not reached since September 2011.
- Record March withdrawals rounded off a return to seasonally cold temperatures during the 2012-13 winter, in which total withdrawals were 67% above 2011-12 winter levels.
- A number of factors contributed to these increased withdrawals, including: record-high starting inventories, slower production growth, lower net imports, and increased cold-weather-driven residential and commercial demand alongside relatively high levels of winter electric power sector consumption.
- As a result, the Henry Hub spot price averaged $4.17/MMBtu in April 2013, more than double the level a year earlier. However, this price level was still low in historical terms, and despite the high withdrawals, inventories were still at their second-highest end-March level since 1991.
May-December. Spot prices decreased starting in May, and by August had declined to a monthly average of $3.40/MMBtu, before rising back above $4.00/MMBtu by year's end.
- High injections took place during the initial summer months, the result of modest increases in production and a reduction in electric power sector consumption from year-ago levels.
- Seasonally cool summer temperatures and relatively higher prices made natural gas less competitive with coal, reducing natural gas consumption in the electric power sector.
- Prices rose slightly in September and October, and approached $4.00/MMBtu in November, which saw a record storage withdrawal for that month in its final week. In December, seasonally cold weather pushed prices above $4.50/MMBtu, and led to the second-highest weekly storage withdrawal on record.
Regional price differences. The 2013 price increase, much like the decrease in 2012, was relatively uniform throughout most of the United States, except in parts of the Northeast.
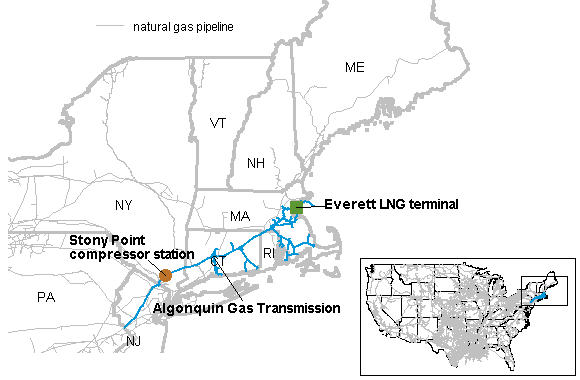
- Prices at the Algonquin Citygate hub serving New England and the Transco Zone 6-NY serving the New York City metropolitan area were affected by demand spikes driven by cold weather in January and December of this year.
- These cold snaps pushed New England and New York spot prices well above the national average because of northeastern pipeline constraints that prevented supply from increasing to meet higher demand.
- Pipeline expansions have alleviated the impact of constraints in the New York/New Jersey market, while constraints remain in New England.
- At the Leidy Interchange Hub in Pennsylvania, a supply backlog from increased Marcellus production muted price increases in 2013. This slower price increase was also apparent at the TCO Appalachia hub, where spot prices did not trade above Henry Hub after November 1.
Note: Spot prices are averaged by delivery date.
Production. Natural gas dry production rose by 1% in 2013 over year-ago levels, according to the Short-Term Energy Outlook. Although this growth can be considered relatively flat compared to the 7% annual growth in 2011 and 5% annual growth in 2012, it limited the degree to which prices rose over last year's 13-year low.
- Natural gas production growth accelerated in the Appalachian Basin's Marcellus Shale play, where gross natural gas withdrawals rose by 48% (3.7 Bcf/d) in 2013, and in the Eagle Ford play in south Texas, where withdrawals rose by 35% (1.4 Bcf/d in 2013), according to data in EIA's Drilling Productivity Report.
- These increases were partially offset by production declines elsewhere, including the Haynesville Shale formation in Texas and Louisiana and the Barnett Shale formation in Texas, as well as continued declines in federal offshore Gulf of Mexico production.
Futures markets. Natural gas markets witnessed reduced seasonality in 2013, with smaller differences between natural gas spot prices and contracts for future delivery.
- Higher overall supply and a greater overall percentage of natural gas consumption coming from the electric power sector have partially insulated prices from the effects of higher demand during winter and summer months.
- The difference between the month-ahead natural gas futures contract and natural gas spot prices, largely a function of anticipated changes in natural gas availability, averaged 7 cents/MMBtu in 2012, but decreased to zero in 2013.
- The front-month contract settled below the day-ahead spot price on many days, including eight trading days in November.
Principal contributor: Mike Ford
Tags: exports/imports, map, Marcellus, natural gas, prices, production/supply, storage