
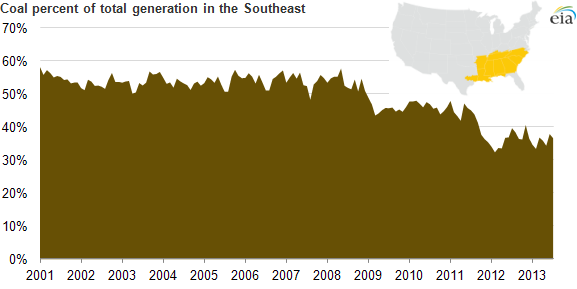
Use of coal-fired generators in the Southeast has been declining
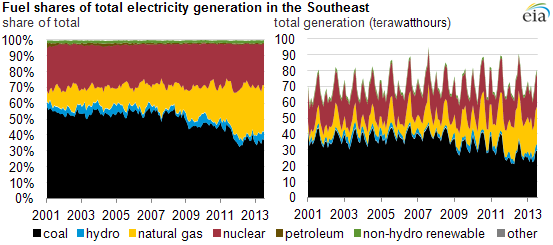
Note: Other refers to electricity generated from the non-biogenic portion of municipal solid waste, other non-renewable waste fuels, hydroelectric pumped storage, other energy storage, and other sources.
The region with the largest shift between coal and natural gas in terms of both the overall generation levels and the relative fuel mix has been in the Southeast. Lower natural gas prices, a concentration of highly efficient natural gas-fired generators, and the high cost of shipping coal from production regions have all contributed to this shift.
The Southeast includes three large, vertically integrated utility systems as well as a patchwork of smaller service territories. While these systems do not dispatch, or run, generation units through auctions like regional transmission organizations, they still generally choose which units to run based on the fuel costs associated with operating them.
Electric units that are fired by all types of coal were backed down during the spring of 2012, when natural gas prices in the region were at their lowest point in a decade. Coal-fired generation rebounded modestly in 2013 as natural gas prices rose above their 2012 levels, but coal is still contributing less than 50% of regional generation this year, which is a dramatic shift from 2001-09.
Power plants in the Southeast are as much as 1,600 miles from cheap Powder River Basin coal and have traditionally used both that resource and Central Appalachian Basin coal that comes from mines in the East. The chart below shows the delivered cost of fuels for natural gas, bituminous coal (typically sourced from eastern mines), and subbituminous coal (which largely comes from mines in the West like the Powder River Basin).
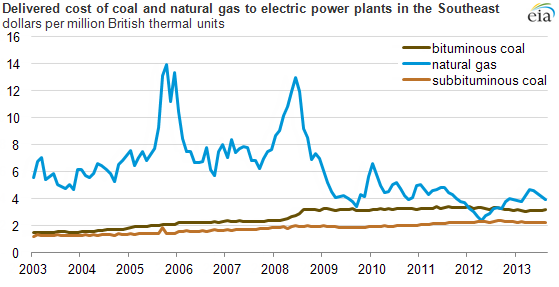
Although they are volatile at times, natural gas prices as delivered to electric power plants in the Southeast have been hovering at or below $4 per million British thermal units (MMBtu) since 2011. Delivered coal prices, in contrast, have been holding steady or rising since 2003. Natural gas-fired units have been able to take advantage of lower prices, leading to the drop in coal-fired output in the region. The Southeast is also home to a concentration of highly efficient natural gas combined-cycle plants (see the red circle in the graph below), meaning that the region could take advantage of the lower natural gas prices to displace a large amount of coal-fired generation.
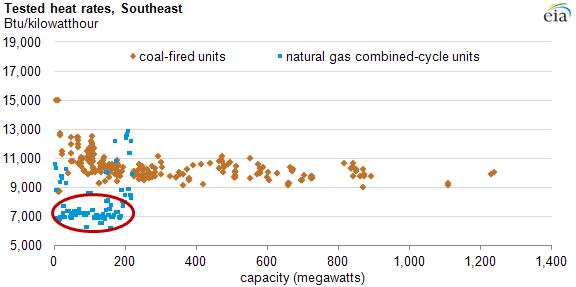
Note: Tested heat rates are measures of operational efficiency of electric power generators under conditions similar to full load. Chart does not include outlier data points.
Principal contributor: M. Tyson Brown