U.S. Energy Information Administration logo
Skip to sub-navigation
November 18, 2013

Electricity in the Mid-Atlantic region is predominantly fueled by coal and nuclear sources
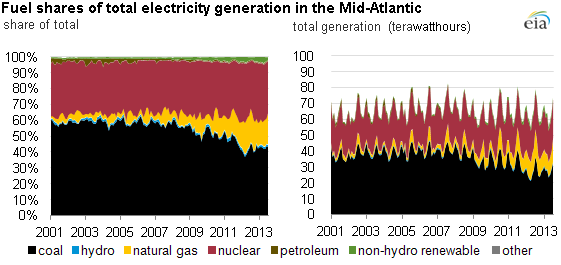
graph of mid-atlantic electricity generation, as explained in the article text
Source: U.S. Energy Information Administration, Electricity Monthly Update
Note: Other refers to electricity generated from the non-biogenic portion of municipal solid waste, other non-renewable waste fuels, hydroelectric pumped storage, other energy storage, and other sources.

In the Mid-Atlantic region, the decline in natural gas prices led to an increase in the use of natural gas for power generation, but the region remains mostly fueled by coal and nuclear sources of electricity.

The Mid-Atlantic electric region in this analysis is represented by the PJM Interconnection's electric system, the largest single electric system in the nation in terms of customers served. The fuel mix in this region has remained fairly consistent, compared to the larger shifts seen in other regions.

Natural gas power generation increased because of low natural gas prices in 2012 and 2013 (especially in states such as Ohio and Pennsylvania), but the availability of cheap coal from the Illinois Basin has kept coal-fired units producing nearly half of the output in PJM's system, especially in the western portion (Indiana and Illinois).

Although natural gas-fired units do not make up a majority of the generation units in this region, these units often set the wholesale electricity price. This is because in the PJM market, the electricity price is determined by the last unit selected (the marginal unit) to run at a given time, based on fuel and other operating costs. Because natural gas often fuels the last unit selected, the wholesale power price in the PJM system generally moves with the natural gas price on any given day (see graph below).
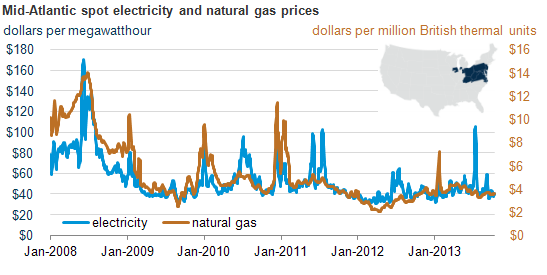
graph of mid-atlantic spot electricity and natural gas prices, as explained in the article text
Source: U.S. Energy Information Administration based on SNL Energy
Note: Data are the rolling seven-day average. The electricity price is PJM West, and the natural gas price is the TETCO M-3 zone.

Principal contributor: M. Tyson Brown

Statistics
Analysis
Tools
Education
News

Petroleum & Other Liquids

Crude oil, gasoline, heating oil, diesel, propane, and other liquids including biofuels and natural gas liquids.

Natural Gas

Exploration and reserves, storage, imports and exports, production, prices, sales.

Electricity

Sales, revenue and prices, power plants, fuel use, stocks, generation, trade, demand & emissions.

Coal

Reserves, production, prices, employment and productivity, distribution, stocks, imports and exports.

Nuclear & Uranium

Uranium fuel, nuclear reactors, generation, spent fuel.

Renewable & Alternative Fuels

Includes hydropower, solar, wind, geothermal, biomass and ethanol.

EIA Survey Forms

Forms EIA uses to collect energy data including descriptions, links to survey instructions, and additional information.

Total Energy

Comprehensive data summaries, comparisons, analysis, and projections integrated across all energy sources.

U.S. States

State energy information, including overviews, rankings, data, and analyses.

International

International energy information, including overviews, rankings, data, and analyses.

Environment

Greenhouse gas data, voluntary reporting, electric power plant emissions.

Data Tools, Apps, & Maps

Tools to customize searches, view specific data sets, study detailed documentation, and access time-series data.

Open Data

EIA's free and open data available as API, Excel add-in, bulk files, and widgets

EIA Beta

Come test out some of the products still in development and let us know what you think!

Open Source Code

EIA's open source code, available on GitHub.

RSS Feeds

Subscribe to feeds for updates on EIA products including Today in Energy and What's New.