The mix of fuels used for electricity generation in the United States is changing
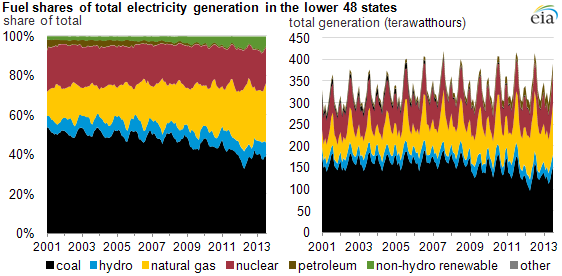
Note: Other refers to electricity generated from the non-biogenic portion of municipal solid waste, other non-renewable waste fuels, hydroelectric pumped storage, other energy storage, and other sources.
The mix of fuels used to generate the electricity in homes, factories, and businesses across the United States has changed in the past few years as coal, still the largest single fuel used for electricity, has lost some of its share of the generation market to natural gas and non-hydroelectric renewables.
The generation mix is not uniform across the country and varies significantly by region depending on available resources and regional market prices. A periodic series of Today in Energy articles in the coming weeks will focus on the changes in fuel use for electricity generation in recent years for seven regions of the United States (see map below).
Natural gas has gained market share from coal in much of the country, but this is less true in markets closer to the cheaper Powder River Basin coal in the West. Renewable sources are generally growing, especially in Texas and the West. Petroleum-fired electricity generation has been declining for several decades, but it can play an important role at rare times when other alternatives are not available.
The method of selecting which power plants to run in a given hour (also called unit dispatch) varies by system but is generally based on the cost of operation of available power plants. A particular region's capacity, the delivered costs of fuels, and system constraints all affect the overall fuel mix in a given month. The U.S. Energy Information Administration publishes monthly data on generation by region in the Electricity Monthly Update. These regions are representative of electric markets (or groups of markets with similar characteristics), which are shown in the map below.
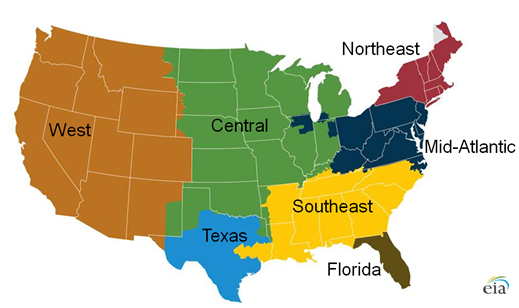
Note: The gray area in Northern Maine is an area of the continental United States that is not connected to the wider U.S. grid.
Principal contributor: M. Tyson Brown