EIA's new map layers provide more detailed information on petroleum infrastructure
In recent years, midstream U.S. crude oil infrastructure has adapted to increased onshore oil production, leading to some changes in crude oil and petroleum product movement around the country. To help users understand and keep up with changes in petroleum infrastructure, the U.S. Energy Information Administration has added new petroleum layers to the maps on its State Energy Profiles and Energy Disruption pages.
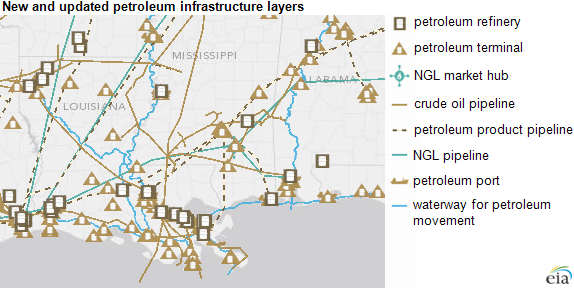
EIA's State Energy Profiles and Energy Disruption pages have always included map layers for petroleum refineries, petroleum-fired power plants, and government stockpiles of crude oil (the Strategic Petroleum Reserve) and heating oil (the Northeast Home Heating Oil Reserve). EIA has now expanded these layers to include new asset families such as crude oil and petroleum product pipelines, as wells as petroleum terminals, petroleum ports, waterways for petroleum movements, natural gas liquids (NGL) pipelines, and NGL market hubs. The new layers also provide updated information on crude oil refineries and petroleum power plants:
- Petroleum Refineries (brown square symbol). Updated layer of 143 refineries with January 1, 2013, data from EIA's Refinery Capacity Report (EIA-820).
- Pipelines (solid tan line for crude oil, dashed brown line for petroleum product, and light blue/teal line for NGL). Three new layers show 90 crude, 65 refined product, and 25 NGL pipelines using a variety of sources to approximate location of the pipelines. The pipelines include interstate transmission (or trunk) and selected intrastate pipeline systems and exclude gathering lines. The State Energy Profile maps continue to access the Department of Transportation's hazardous liquids pipeline layer at the county level.
- Petroleum Terminals (tan triangle symbol). New layer of 1,400 privately owned and operated terminals with storage capacity of 50,000 barrels or more or that receive petroleum products by tanker, barge, or pipeline based on EIA's Monthly Bulk Terminal and Blender Report (EIA-815), as of March 2013.
- NGL Market Hubs (light blue/teal spoke symbol). Major storage and trading hubs in Mont Belview, Texas; Conway, Kansas; and Hattiesburg, Mississippi.
- Petroleum Ports (tan ship symbol). New layer of 196 ports that process at least 200 short tons per year of total petroleum imports and exports, based on data from the U.S. Army Corps of Engineers, Ports and Waterways Facilities.
- Waterways for Petroleum Movements (blue line). New layer of 30 waterways with total movement (both upstream and downstream) of at least 700 short tons per year of petroleum products, based on data from the U.S. Army Corps of Engineers, Ports and Waterways Facilities.
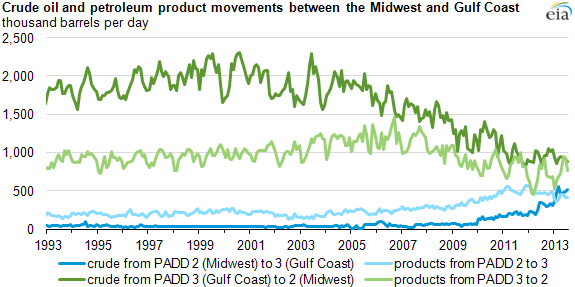
As shown in the graph above and as displayed in the new maps, the pattern of crude oil and petroleum product shipments between the Gulf Coast (PADD 3) and Midwest (PADD 2) is changing. Much of the increase in onshore crude oil production is in the upper Midwest and Rocky Mountain regions, particularly the Bakken formation in North Dakota. Pipeline capacity to move this crude oil to the major refining centers on the Gulf Coast has, at times, lagged the production increases, leading to discounted pricing for crude oil in the Midcontinent.
The discounted crude pricing has encouraged U.S. refineries to increase utilization and has spurred investment in new distribution infrastructure that will alleviate the bottleneck. The new infrastructure includes new pipelines, as well as expansions and direction reversals of existing lines, and even repurposing of pipelines to transport different hydrocarbons. As a result, Midwestern refiners are bringing less crude oil north from the Gulf Coast and are supplying more refined petroleum products from within the region. Conversely, crude oil shipments to the Gulf Coast region from the Midwest have increased as additional transportation options have become available when shipments of refined products from the Gulf Coast to the Midwest have declined.
Shifts in regional availability of crude oil and petroleum products combined with limited or fully utilized pipeline capacity have also prompted greater reliance on rail and waterborne transportation. Despite the use of alternate transport modes, pipelines remain the primary mode of transporting crude oil and petroleum products in the United States, typically accounting for more than 90% of total movements nationwide. According to the U.S. Department of Transportation, the total miles of crude oil and petroleum product pipelines in the United States rose at a 1.6% average annual rate from 2007 to 2012, increasing by more than 9,000 miles to almost 121,000 miles in 2012.
See the U.S. States Notes & Sources page for more information on the map layers.
Principal contributor: Jim O'Sullivan
Tags: liquid fuels, map, oil/petroleum, pipelines, United States