Released: July 11, 2013
Next Release: July 17, 2013
U.S. crude oil increasingly moves by barge, truck and rail
The U.S. Energy Information Administration (EIA) recently released its annual data series tracking how crude oil reaches the refinery gate. Not surprisingly, the 2012 data show heightened reliance on crude receipts via barge, truck and rail.
There has been much discussion about the rise in U.S. crude oil production and the resulting overhang in inventories at Cushing, Oklahoma and elsewhere in the midcontinent because of pipeline infrastructure that has not kept pace with burgeoning domestic crude oil supply. The supply-pipeline mismatch is encouraging market participants to increasingly rely on alternative transportation options.
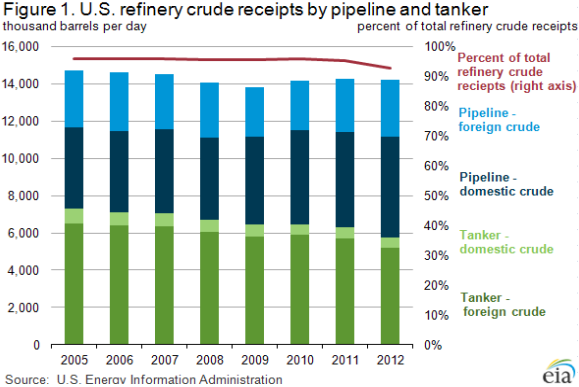
From 2005 to 2010, 96 percent of refinery crude oil receipts came by pipeline and tanker (ship). With relatively low costs and high capacity, pipelines have long been the delivery method of choice for inland refineries. Coastal refineries, on the other hand, have typically been served by tankers of waterborne imports or offshore production. In 2011, this usage began to decline, and in 2012, pipelines and tankers delivered 93 percent of crude oil processed by U.S. refiners (Figure 1). The balance is made up primarily of domestic crude supplies carried via barge, rail and truck. Foreign receipts via barge have declined slightly.
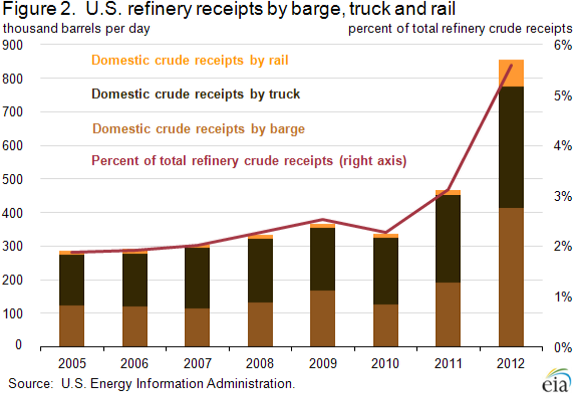
Because truck and rail are less cost-effective options for moving crude, they typically have accounted for a very small portion of refinery crude receipts, averaging just 1 percent of total receipts from 2000 to 2010. Starting in 2011, this truck and rail volume increased, and in 2012 it represented 3 percent of refinery receipts. Additionally, domestic barge receipts also increased, and now account for close to 3 percent (Figure 2). Expanding existing pipelines or building entirely new ones is costly and requires lengthy regulatory review. Using trucks and trains on the other hand, provides greater flexibility and uses existing infrastructure. As long as the Bakken and WTI prices trade at a large enough discount to global, waterborne crudes, these transportation patterns are likely to persist or even expand.
EIA collects data on crude delivery methods annually from all U.S. refineries. In cases where multiple transportation modes are used, respondents report the mode used for the last 100 miles. If several modes are used, and none is more than 100 miles, the method representing the longest distance is recorded. This may partially explain the increase in domestic barge traffic, with crude oil loaded on rail cars at production areas and then transferred to barges for the final leg of some journeys to refineries, particularly on the East Coast and along the Mississippi River. With increased rail traffic reported by the Association of American Railroads for the first half of 2013, it is likely that the EIA data on domestic crude receipts by rail will be higher in EIA's 2013 survey.
In addition to delivering more crude oil to U.S. refineries, railroads are shipping U.S. crude oil to eastern Canadian refineries. While the Midwest has been the traditional source for U.S. crude oil exports to Canada, a recent increase in exports is being led by deliveries from the Gulf Coast (waterborne) and the East Coast. The exports from the East Coast are primarily barrels that moved east from North Dakota's Bakken region by rail and are then exported through New York state. Small amounts of Canadian crude are also starting to move by rail to U.S. refineries, with 2011 marking the first time in 10 years that foreign-sourced rail shipments were reported. At nearly 1,000 barrels per day (bbl/d), this was the highest volume of foreign oil-by-rail recorded since EIA started publishing these data in 1981. In 2012 that number set a new record of more than 11,000 bbl/d.
Gasoline price decreases while diesel fuel increases
The U.S. average retail price of regular gasoline decreased less than a penny to $3.49 per gallon as of July 8, 2013, up eight cents from last year at this time. The Midwest price increased two cents to $3.41 per gallon, while prices in all other regions decreased. The largest decrease came in the Rocky Mountain region, where the price is $3.61 per gallon, down three cents from last week. The Gulf and West Coast prices both decreased two cents, to $3.30 and $3.88 per gallon, respectively. Rounding out the regions, the East Coast price is down one cent to $3.46 per gallon.
The national average diesel fuel price increased one cent to $3.83 per gallon, 15 cents higher than last year at this time. The Rocky Mountain price decreased one cent to $3.81 per gallon, while prices in all other regions increased. The largest increase came on the Gulf Coast, where the price is up two cents to $3.75 per gallon. The East Coast, Midwest, and West Coast prices all increased a penny, to $3.83, $3.82, and $3.95 per gallon, respectively.
Propane inventories gain
Total U.S. inventories of propane increased 1.0 million barrels from last week to end at 57.4 million barrels, but are 5.8 million barrels (9.2 percent) lower than the same period a year ago. The Gulf Coast region led the gain with 1.0 million barrels, while East Coast stocks increased by 0.2 million barrels. Midwest stocks increased by 0.1 million barrels and Rocky Mountain/West Coast stocks decreased by 0.3 million barrels. Propylene non-fuel-use inventories represented 5.3 percent of total propane inventories.
Text from the previous editions of This Week In Petroleum is accessible through a link at the top right-hand corner of this page.
 |
 |
||||||
| Retail Data | Change From Last | Retail Data | Change From Last | ||||
| 07/08/13 | Week | Year | 07/08/13 | Week | Year | ||
| Gasoline | 3.492 | Diesel Fuel | 3.828 | ||||
 |
 |
||||||||||||||||||||||||||
|
 |
||||||||||||||||||||||||||
| *Note: Crude Oil Price in Dollars per Barrel. | |||||||||||||||||||||||||||
 |
 |
||||||
 |
 |
||||||
| Stocks Data | Change From Last | Stocks Data | Change From Last | ||||
| 07/05/13 | Week | Year | 07/05/13 | Week | Year | ||
| Crude Oil | 373.9 | Distillate | 123.8 | ||||
| Gasoline | 221.0 | Propane | 57.374 | ||||