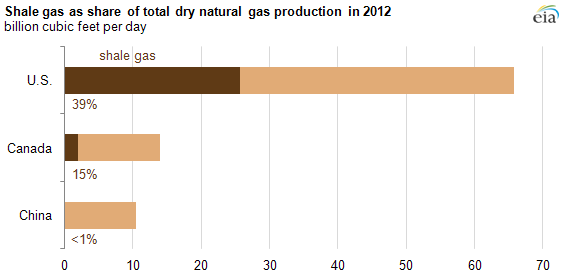
North America leads the world in production of shale gas
Note: Canadian data uses "marketable production," which is comparable to dry production.
The United States and Canada are the only major producers of commercially viable natural gas from shale formations in the world, even though about a dozen other countries have conducted exploratory test wells, according to a joint U.S. Energy Information Administration (EIA)/Advanced Resources International (ARI) study released in June. China is the only nation outside of North America that has registered commercially viable production of shale gas, although the volumes contribute less than 1% of the total natural gas production in that country. In comparison, shale gas as a share of total natural gas production in 2012 was 39% in the United States and 15% in Canada.
Shale gas dry production in the United States averaged 25.7 billion cubic feet per day (Bcf/d) in 2012, while total dry production averaged 65.7 Bcf/d. In Canada, total dry natural gas production from the two major shale plays—the Muskwa-Otter Park shale formation in the Horn River Basin of northern British Columbia and the adjacent Montney Basin that spreads over British Columbia and Alberta—averaged 2.0 Bcf/d in 2012, while total Canadian production averaged 14.0 Bcf/d. Gross withdrawals from Horn River and Montney averaged 2.5 Bcf/d in 2012, and reached 2.8 Bcf/d by May 2013. The potential for higher production from these two plays is currently constrained by limited pipeline infrastructure.
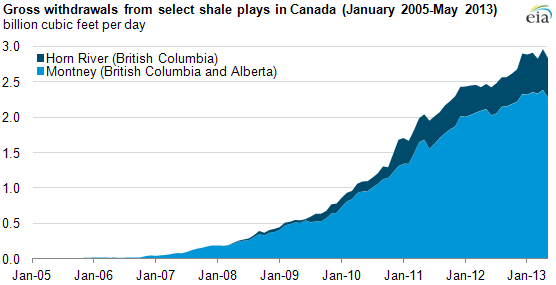
Note: Graph depicts "raw" natural gas production, a measure used by the NEB that is comparable to gross withdrawals. Raw natural gas production is the volume of natural gas produced at the wellhead.
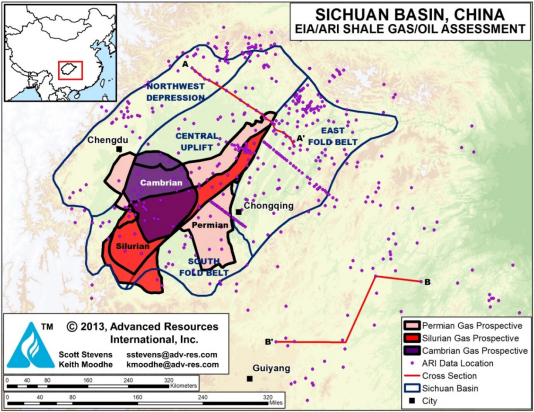
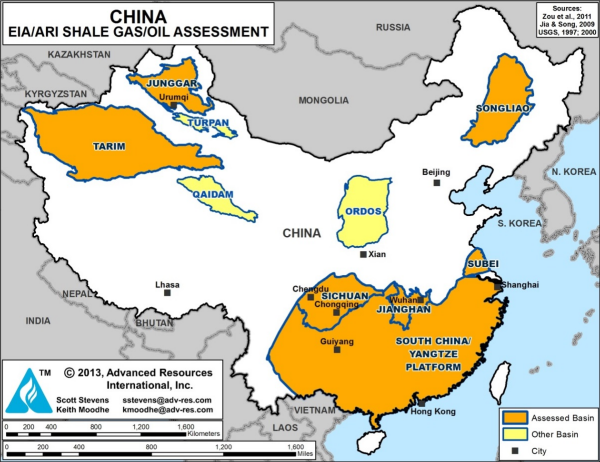
China was ranked as the largest holder of shale gas resources among the 41 countries assessed for technically recoverable shale resources in the study released by EIA/ARI this past June. The Chinese government has not officially reported on shale gas production, but some independent Chinese energy analysts have claimed commercial production of at least 0.003 Bcf/d of shale gas, mainly from the Sichuan Basin.
Note: Click to enlarge.
Principal contributor: Aloulou Fawzi
Tags: Canada, China, drilling, international, map, natural gas, production/supply, resources, shale