World Shale Resource Assessments
Last updated: September 24, 2015
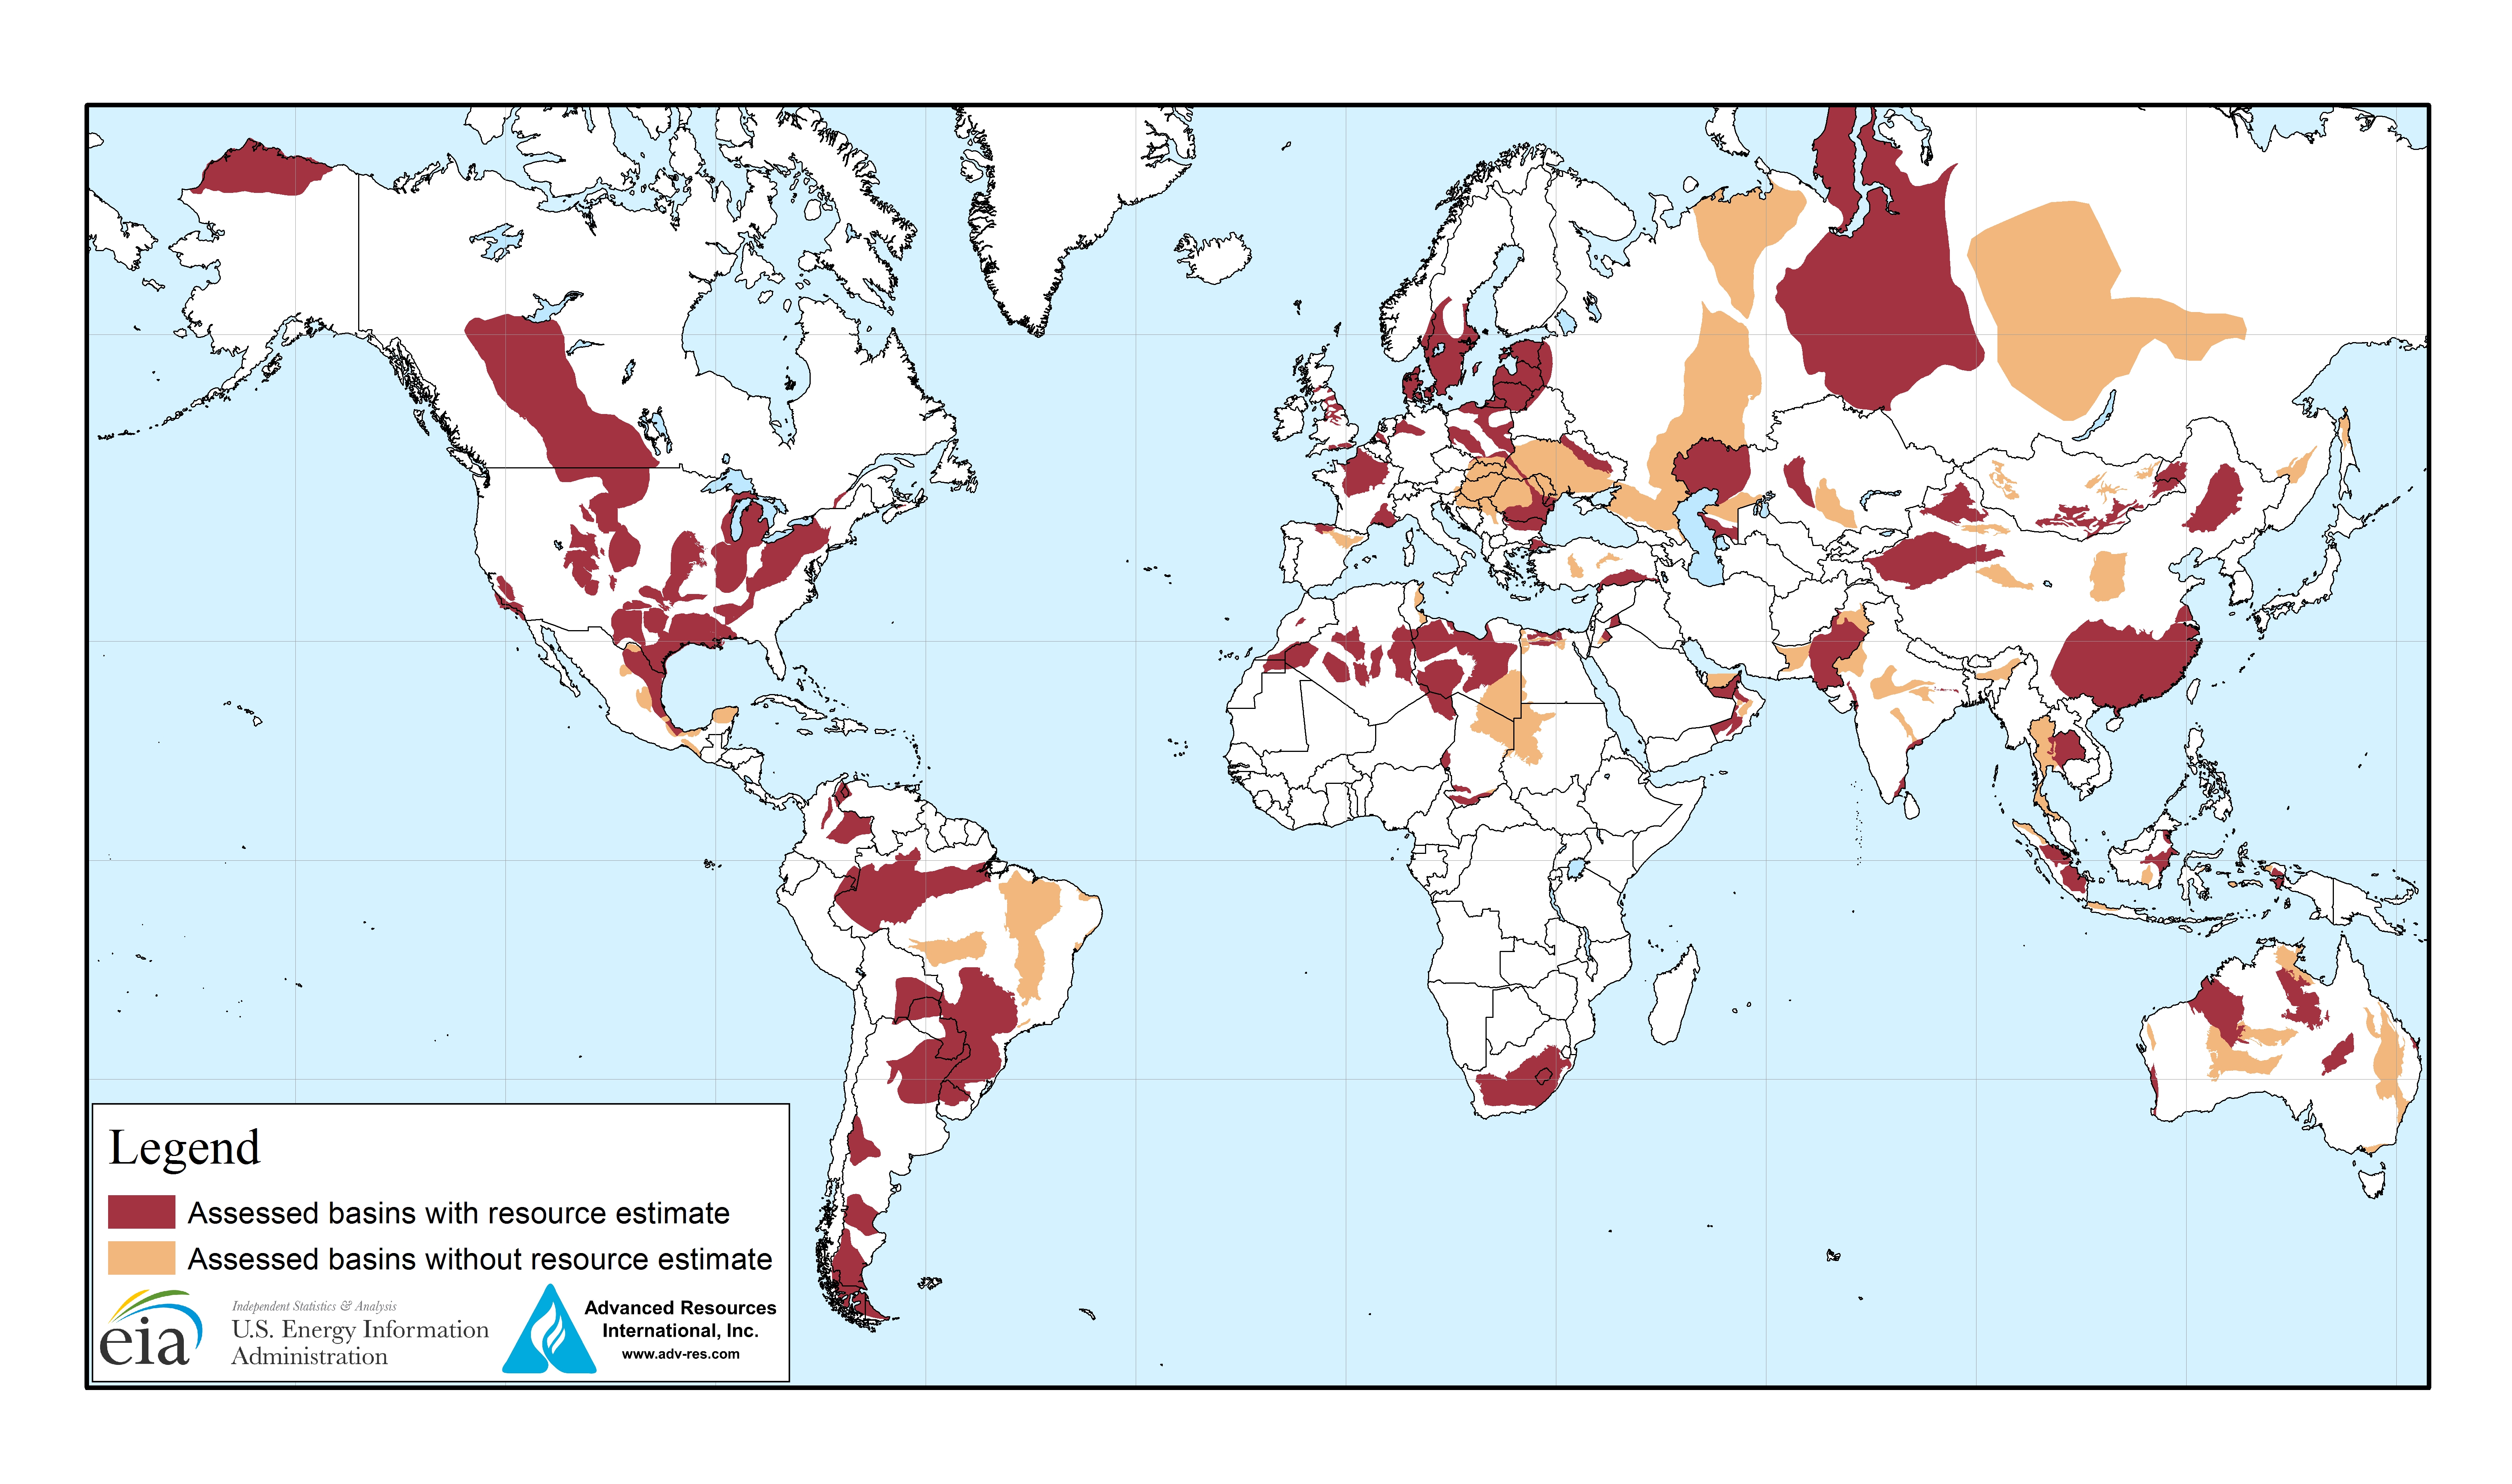
This series of reports provides an initial assessment of world shale oil and shale gas resources. The first edition was released in 2011 and updates are released on an on-going basis. Four countries were added in 2014: Chad, Kazakhstan, Oman and the United Arab Emirates (UAE) and are available as supplemental chapters to the 2013 report Technically Recoverable Shale Oil and Shale Gas Resources.
The most current version of each country chapter is linked in the table of countries below. Archived editions are provided in links in the sidebar column to the right.
| Unproved technically recoverable | ||||
|---|---|---|---|---|
| Region | Country | wet shale gas (trillion cubic feet) |
tight oil (billion barrels) |
Date updated |
| North America | ||||
| Canada | 572.9 | 8.8 | 5/17/13 | |
| Mexico | 545.2 | 13.1 | 5/17/13 | |
| U.S.1 | 622.5 | 78.2 | 4/14/15 | |
| Australia | ||||
| Australia2 | 429.3 | 15.6 | 5/17/13 | |
| South America | ||||
| Argentina | 801.5 | 27.0 | 5/17/13 | |
| Bolivia | 36.4 | 0.6 | 5/17/13 | |
| Brazil | 244.9 | 5.3 | 5/17/13 | |
| Chile | 48.5 | 2.3 | 5/17/13 | |
| Colombia | 54.7 | 6.8 | 5/17/13 | |
| Paraguay | 75.3 | 3.7 | 5/17/13 | |
| Uruguay3 | 4.6 | 0.6 | 5/17/13 | |
| Venezuela | 167.3 | 13.4 | 5/17/13 | |
| Eastern Europe | ||||
| Bulgaria | 16.6 | 0.2 | 5/17/13 | |
| Lithuania/Kaliningrad | 2.4 | 1.4 | 5/17/13 | |
| Poland | 145.8 | 1.8 | 5/17/13 | |
| Romania | 50.7 | 0.3 | 5/17/13 | |
| Russia | 284.5 | 74.6 | 5/17/13 | |
| Turkiye | 23.6 | 4.7 | 5/17/13 | |
| Ukraine | 127.9 | 1.1 | 5/17/13 | |
| Western Europe | ||||
| Denmark | 31.7 | 0.0 | 5/17/13 | |
| France | 136.7 | 4.7 | 5/17/13 | |
| Germany | 17.0 | 0.7 | 5/17/13 | |
| Netherlands | 25.9 | 2.9 | 5/17/13 | |
| Norway | 0.0 | 0.0 | 5/17/13 | |
| Spain | 8.4 | 0.1 | 5/17/13 | |
| Sweden | 9.8 | 0.0 | 5/17/13 | |
| United Kingdom | 25.8 | 0.7 | 5/17/13 | |
| North Africa | ||||
| Algeria | 706.9 | 5.7 | 5/17/13 | |
| Egypt | 100.0 | 4.6 | 5/17/13 | |
| Libya | 121.6 | 26.1 | 5/17/13 | |
| Mauritania | 0.0 | 0.0 | 5/17/13 | |
| Morocco | 11.9 | 0.0 | 5/17/13 | |
| Tunisia | 22.7 | 1.5 | 5/17/13 | |
| West Sahara | 8.6 | 0.2 | 5/17/13 | |
| Sub-Saharan Africa | ||||
| Chad | 44.4 | 16.2 | 12/29/14 | |
| South Africa | 389.7 | 0.0 | 5/17/13 | |
| Asia | ||||
| China | 1115.2 | 32.2 | 5/17/13 | |
| India | 96.4 | 3.8 | 5/17/13 | |
| Indonesia | 46.4 | 7.9 | 5/17/13 | |
| Mongolia | 4.4 | 3.4 | 5/17/13 | |
| Pakistan | 105.2 | 9.1 | 5/17/13 | |
| Thailand | 5.4 | 0.0 | 5/17/13 | |
| Caspian | ||||
| Kazakhstan | 27.5 | 10.6 | 12/29/14 | |
| Middle East | ||||
| Jordan | 6.8 | 0.1 | 5/17/13 | |
| Oman | 48.3 | 6.2 | 12/29/14 | |
| United Arab Emirates | 205.3 | 22.6 | 12/29/14 | |
| 46 Countries' total | 7,576.6 | 418.9 | ||
bbl = barrels; Tcf = trillion cubic feet. |
||||