Lower railroad energy consumption reflects improved efficiency, reduced tonnage
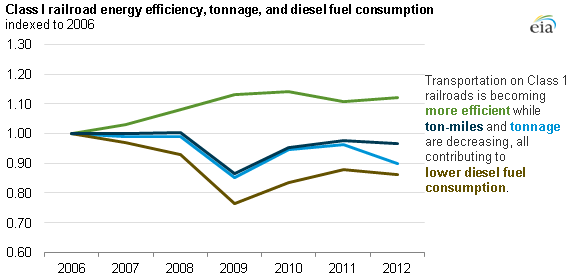
Diesel fuel consumption by Class I railroads represented 12% of all diesel fuel demand in the transportation sector in the United States in 2012. Diesel fuel consumption in 2012 was higher than the low of 3.2 billion gallons used during the 2009 economic recession, but still 14% below the 2006 peak of 4.2 billion gallons, and slightly below the 3.7 billion gallons consumed during 2011. Improvements in the energy efficiency of moving freight account for most of the reduction in railroad fuel use between 2006 and 2012.
Class I railroads are large line-haul freight rail transportation from operators with annual revenues of $250 million or more. Class I railroads account for about 90% of all railroad freight revenue. The amount of energy needed to move freight by Class I railroads has decreased significantly over time. In 2012, it took 2.1 gallons of diesel fuel to move 1,000 revenue ton-miles of freight, compared to 2.4 gallons in 2006, 2.5 gallons in 2000, and 4.3 gallons of diesel fuel in 1980. Revenue ton-miles are the product of the weight of paid tonnage times the total number of miles it has been transported.
Class I railroads traveled 1.7 billion revenue ton-miles in 2012, slightly less than in 2011 and 4% less than the peak 2008 ton-milage. The decline is because of less tonnage moved, not less distance traveled. The average distance traveled by Class I railroads increased in 2012, but the increase was offset by decreases in tonnage.
Tonnage moved in 2012 was significantly lower than the 2006 peak, which can mainly be attributed to reduced coal shipments. Coal accounted for more than 40% of tonnage moved by Class I railroads, and shipments of coal by rail made up more than 70% of coal delivered to power plants. Because of these high rail shares of coal tonnage and shipments, declines in U.S. coal production affect railcar tonnage. Since 2008, the amount of coal moved by rail has declined, which has contributed to the decline in total tonnage moved by rail. While coal is the commodity with the largest decline, nearly all commodity groups, with the exception of petroleum products, have lower rail tonnages in 2012 than in 2006.
Principal contributor: Nicholas Chase
Tags: rail