Rail traffic reflects more oil production, less coal-fired electricity generation
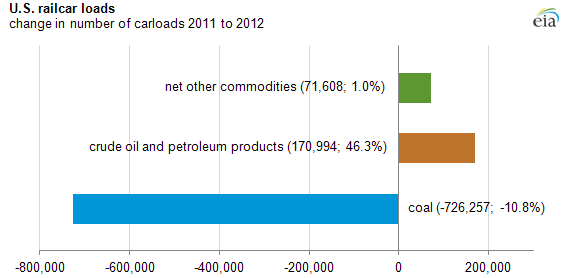
Note: Net other commodities reflects total change in carloadings for agricultural and food products, chemicals, forest products, metallic ores and minerals, motor vehicles and parts, nonmetallic minerals and products, and various other commodities.
The record increase in U.S. crude oil production during 2012 and the significant decline in coal use for domestic electricity generation were reflected in the movement of those two commodities by rail last year. Crude oil and petroleum products accounted for the biggest increase in railcar loadings among commodities in 2012, while coal had the largest decline. Notwithstanding these changes, coal remained by far the dominant category of carload shipments, accounting for 41% of total carloads, compared to a 4% share for all petroleum and petroleum products combined.
Last year, the amount of crude oil and petroleum products delivered by rail increased 46% over 2011, or almost 171,000 carloads, according to the Association of American Railroads (AAR), which tracks movement of commodities by rail. Crude oil accounted for an estimated 38% of the combined deliveries in the oil and petroleum products category during 2012, up from 3% in 2009. The trade group says that crude oil was responsible for nearly all of the growth last year in carloadings in this category.
Typically, about 90% of the crude oil and petroleum products in the United States is transported by pipeline. However, more crude is being moved by rail from areas of the country seeing a boost in oil production, such as North Dakota's Bakken Shale formation, that do not have adequate pipeline infrastructure to transport the oil to refineries. U.S. crude oil production increased by a record 780,000 barrels per day in 2012.
The commodity with the biggest decline in railcar loadings during 2012 was coal, which was down about 726,000 carloads, or nearly 11%, to just over 6 million carloads.
More than 70% of the coal burned by power plants for electricity generation is delivered by rail. However, those deliveries fell in 2012 because of lower demand from power plant operators, who turned to more price-competitive natural gas as a generating fuel. Coal accounted for 37.2% of U.S. electricity generation through November 2012, based on the latest data from EIA's Electric Power Monthly. That level is down from 42.5% during the same 11-month period in 2011. Electricity generation from natural gas increased from 24.6% to 30.8% over the same time.
Net railcar loadings for other nonenergy commodities grew slightly in 2012. Railcar loads of motor vehicles and crushed stone rose the most among nonenergy commodities, while grain and metallic ores saw the largest carload declines for nonenergy commodities. Excluding coal, U.S. railcar loads totaled 8.7 million in 2012, up 3% from the previous year, according to AAR.
Tags: coal, crude oil, electricity, generation, liquid fuels, oil/petroleum, rail, transportation