Spread narrows between Brent and WTI crude oil benchmark prices
Republished: August 5, 2013, 9:50 a.m.: Text was modified to clarify content.
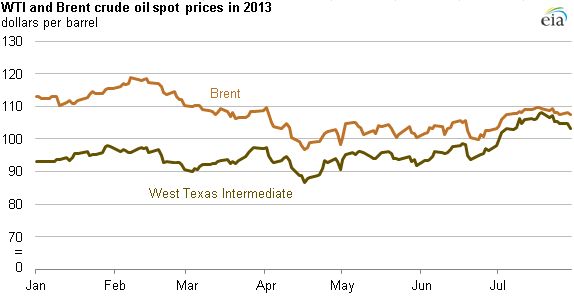
Spot prices for benchmarks West Texas Intermediate (WTI) and North Sea Brent crude oil neared parity of around $109 per barrel July 19, and the Brent-WTI spread was still as close as $4 on July 30. By contrast, the average Brent-WTI price spread in 2012 was about $19 per barrel, and the spread was $23 per barrel as recently as February 2013. Since spring 2013, prices for these benchmarks have moved much closer together, as WTI increased in relation to Brent. This increase in the WTI price was the result of new U.S. transport infrastructure and U.S. refineries running at near-record levels.
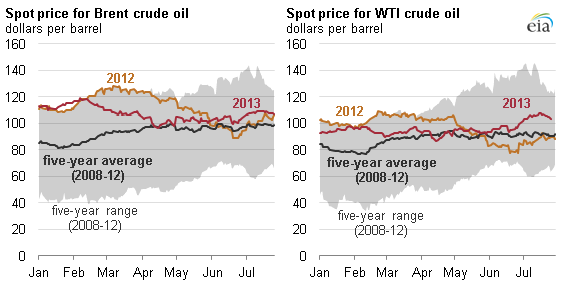
The spread between Brent and WTI began the year averaging $18 per barrel in January, close to its average 2012 level. The spread had reached wide levels in 2012 as increasing oil production from North Dakota and Texas outpaced the ability of existing pipeline infrastructure to bring that crude to refining centers on the U.S. Gulf Coast. This caused shippers to turn to more expensive modes of transport such as railroads and trucks, causing the price of inland crudes such as WTI to decrease to account for the increase in shipping costs.
However, that dynamic began to change in 2013. The Brent-WTI spread began to narrow considerably in March and by July the spread averaged just slightly above $3 per barrel, dipping to the lowest level since the start of 2011.
The strengthening of WTI relative to Brent in the first half of 2013 can be attributed to a number of factors:
- New U.S. crude oil transportation infrastructure came online. Several new crude transportation projects came online in early 2013, including pipelines and crude-by-rail terminals. This new infrastructure helped clear transportation bottlenecks in U.S. Midcontinent, particularly around Cushing, Oklahoma, prompting increases in WTI prices.
- U.S. refineries are running at high levels. Crude runs at refineries have increased steadily since early March to reach some of the highest levels on record. At 16.1 million barrels per day (bbl/d) for the week ending July 5, U.S. crude oil runs were the highest for any week since 2007, helping to elevate WTI prices in the spring and summer of 2013.
- U.S. refineries gain access to domestic light sweet crudes. The expanded crude transportation infrastructure increased refinery access to domestically produced crude oil. Because certain domestic light sweet crudes are of similar quality to Brent, some of this domestic production replaced Brent and Brent-like crude imports at U.S. refineries, putting downward pressure on Brent prices.
EIA expects the WTI discount to widen to $6 per barrel by the end of 2013 as crude oil production in Alberta, Canada, recovers following the heavy June flooding and as Midcontinent production continues to grow.